Snibble Dashboards
Snibble had a content process issue. It relied only on code, which took up a lot of developers' time and affected the platform's quality. Content partners and advertisers wanted portals to manage their content and check stats, while the team needed tools and metrics to help manage the app as it grew.
As part of my work in Snibble I joined the other designer and developers to create tools for internal team to manage the platform and analytics for advertisers and content partners.
Role:
Product Designer
Platform:
Web
Year:
2022 - 2023
Industry:
Entertainment
Dashboards have 3 versions for 3 different groups: content managers & stakeholders and advertisers.
To structure all the data, I spent several weeks interviewing stakeholders, developers and other designers, gathering documentation about the processes and what can be changed and improved. Provided info helped define what each user category expected from the Dashboards.
Content managers & stakeholders:
100% functionality, the ability to change / add content and view statistics
Advertisers
Limited version - monetization & users analytics
Content partners
Limited version - content statistics and some management
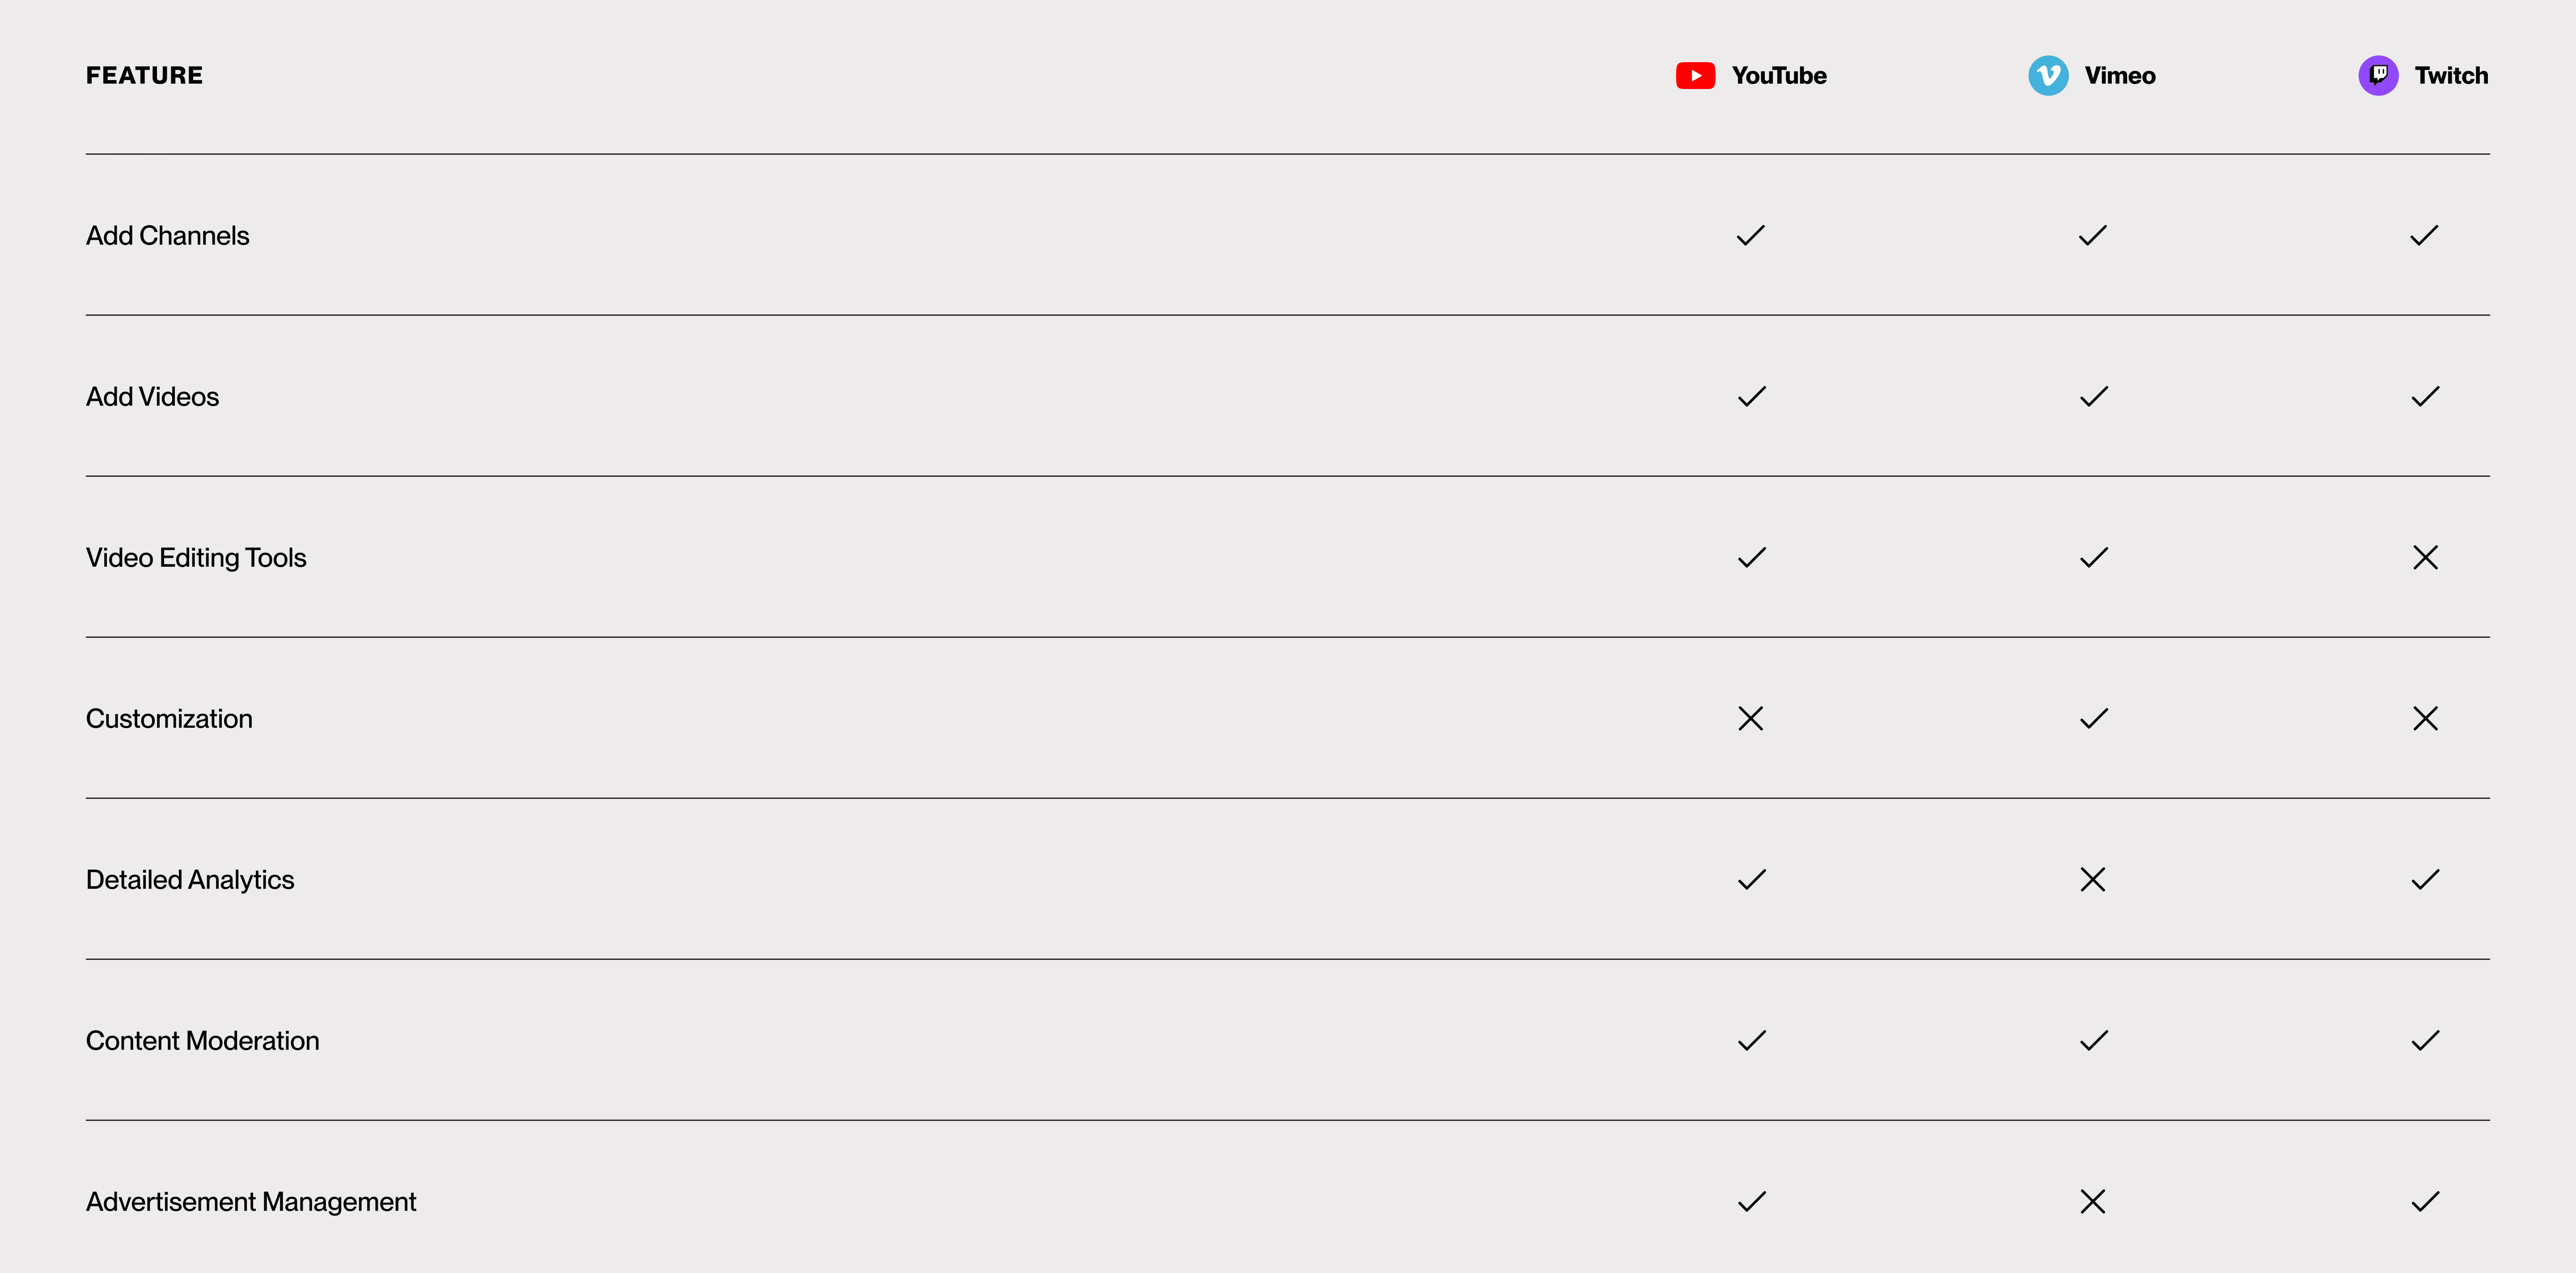
I analyzed platforms that offer tools for managing video content and apps to identify familiar patterns, especially for content partners. Established platforms like YouTube and Twitch informed the design of content curation features and helped prioritize key analytics charts.
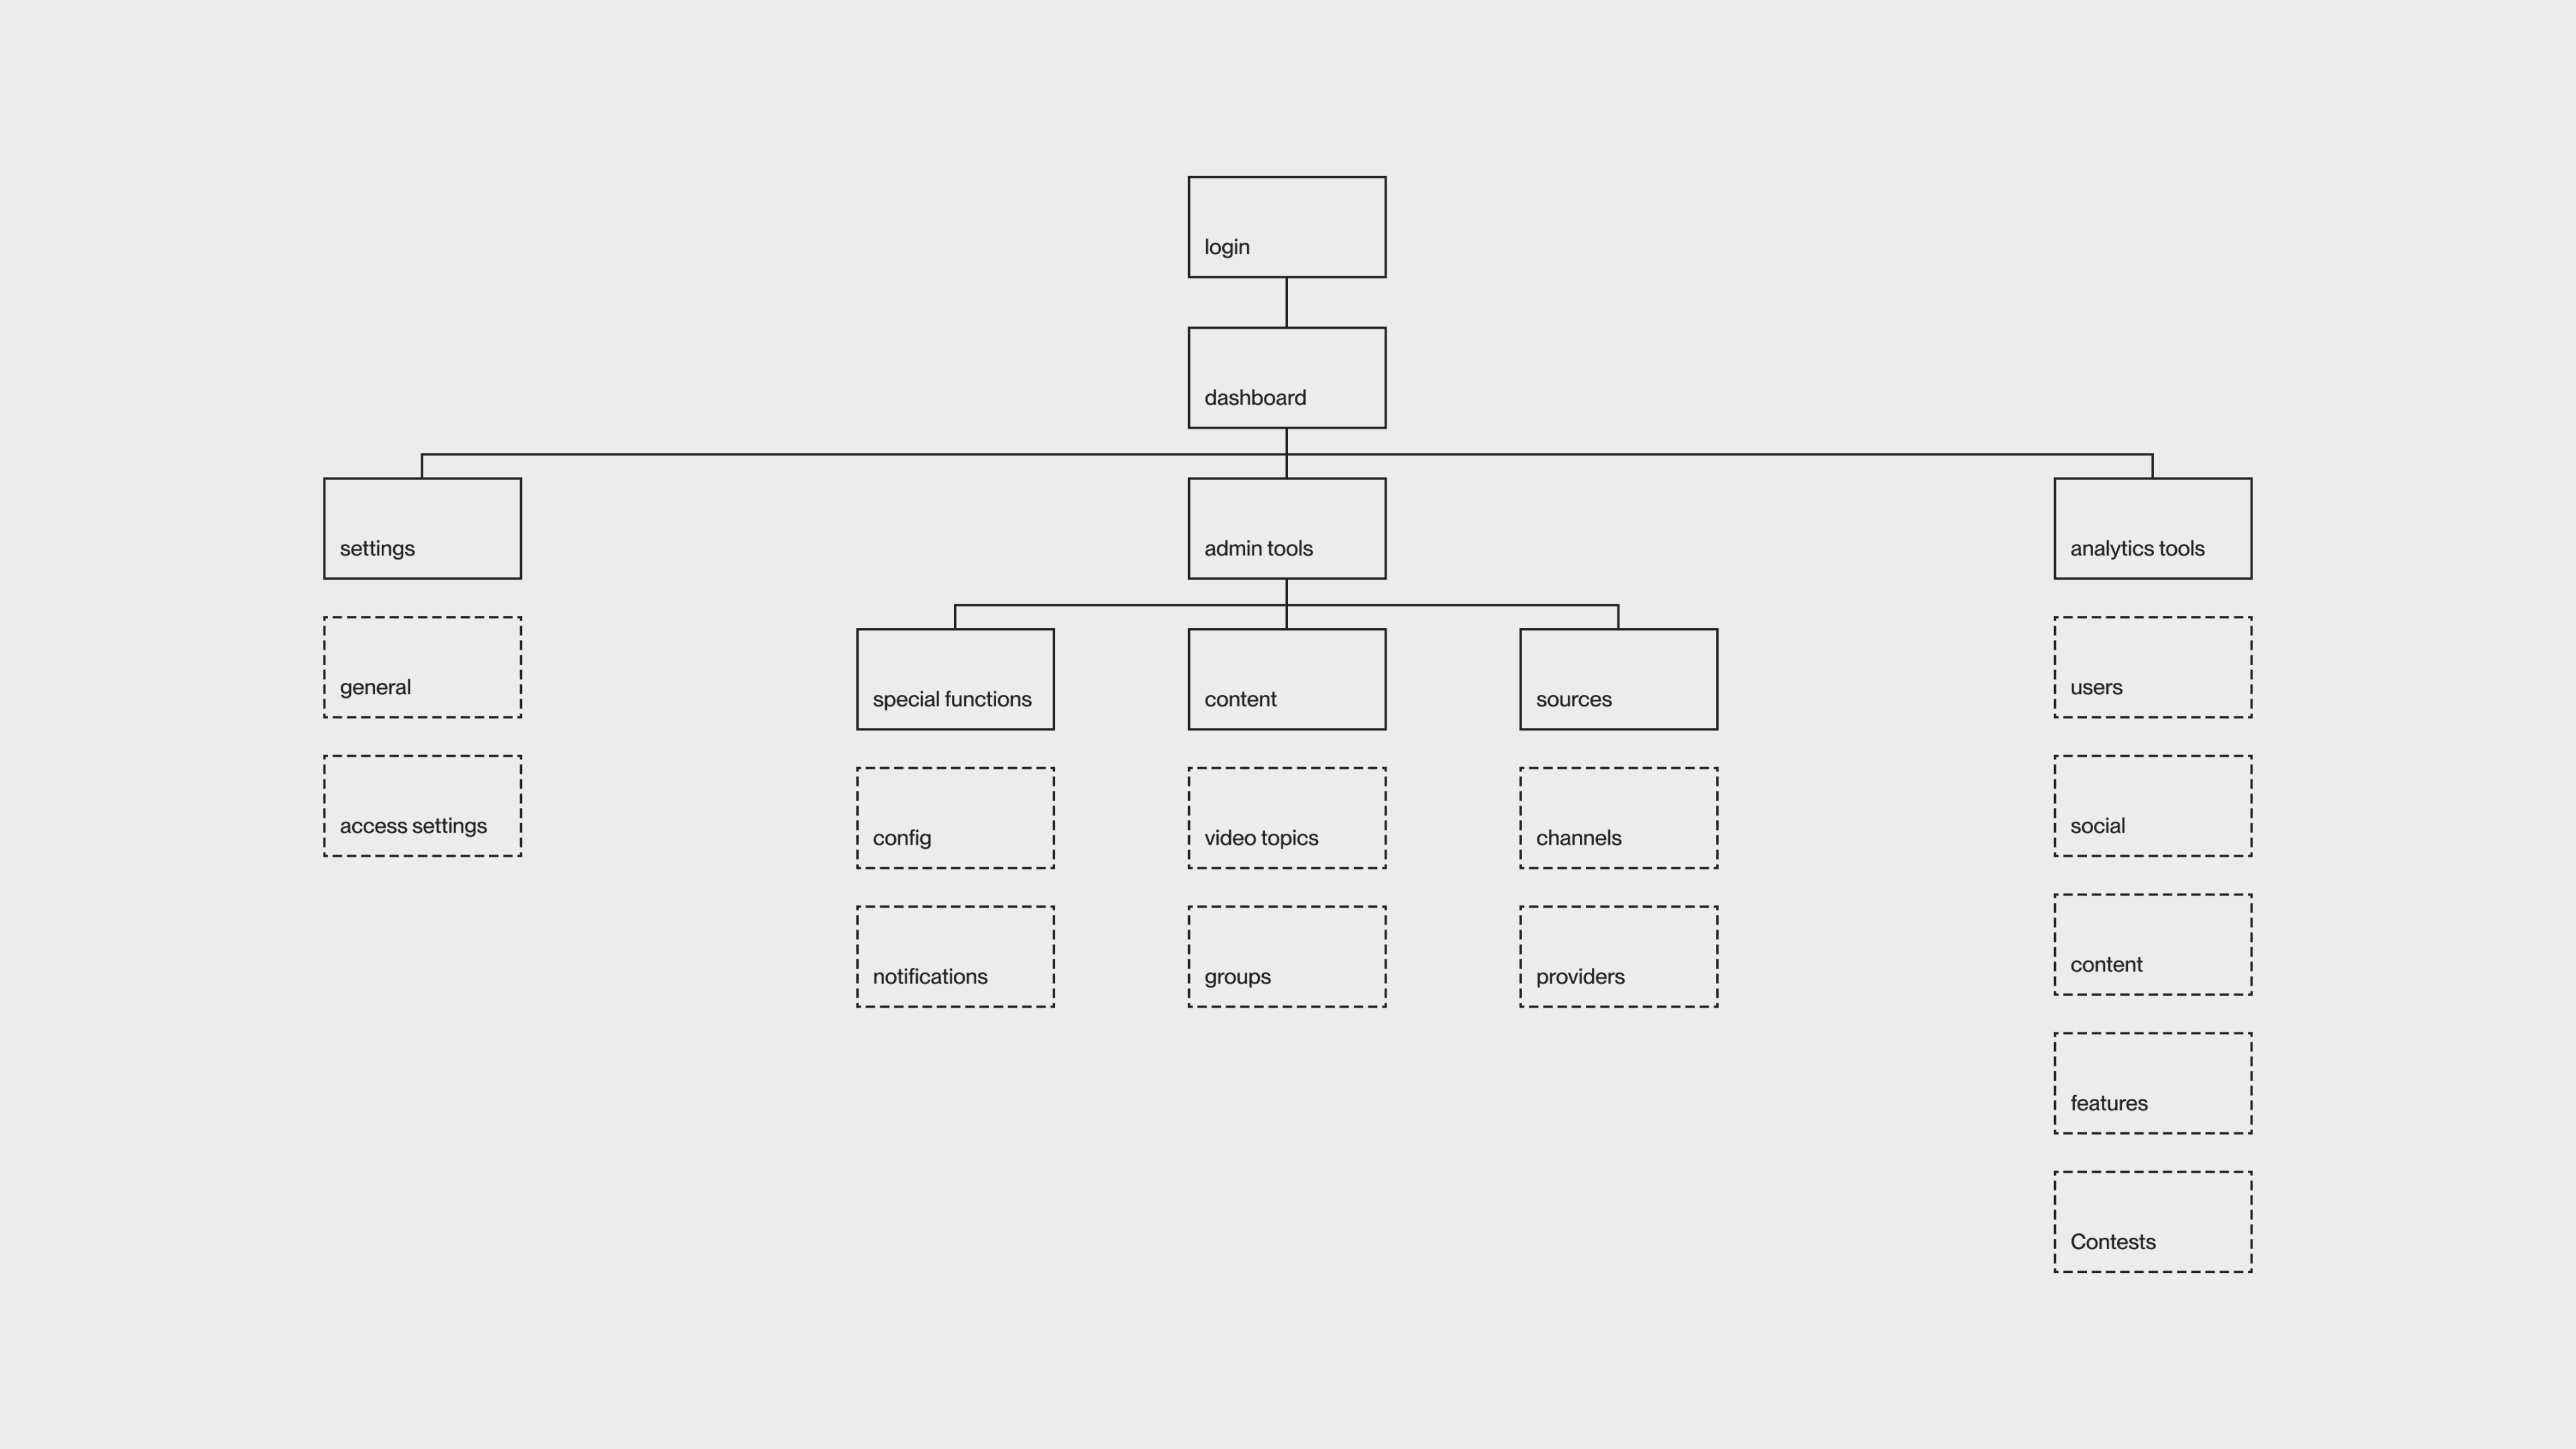
After gathering research insights, I developed the dashboard's architecture, focusing on a flow curated to different user types. Instead of designing multiple portals we decided to create one Dashboard that partially changes depending on the user type. After several iterations, we reached a solution that the developers supported.
We also took this opportunity to standardize the vocabulary, addressing inconsistencies in naming conventions which differed between product team and stakeholders.
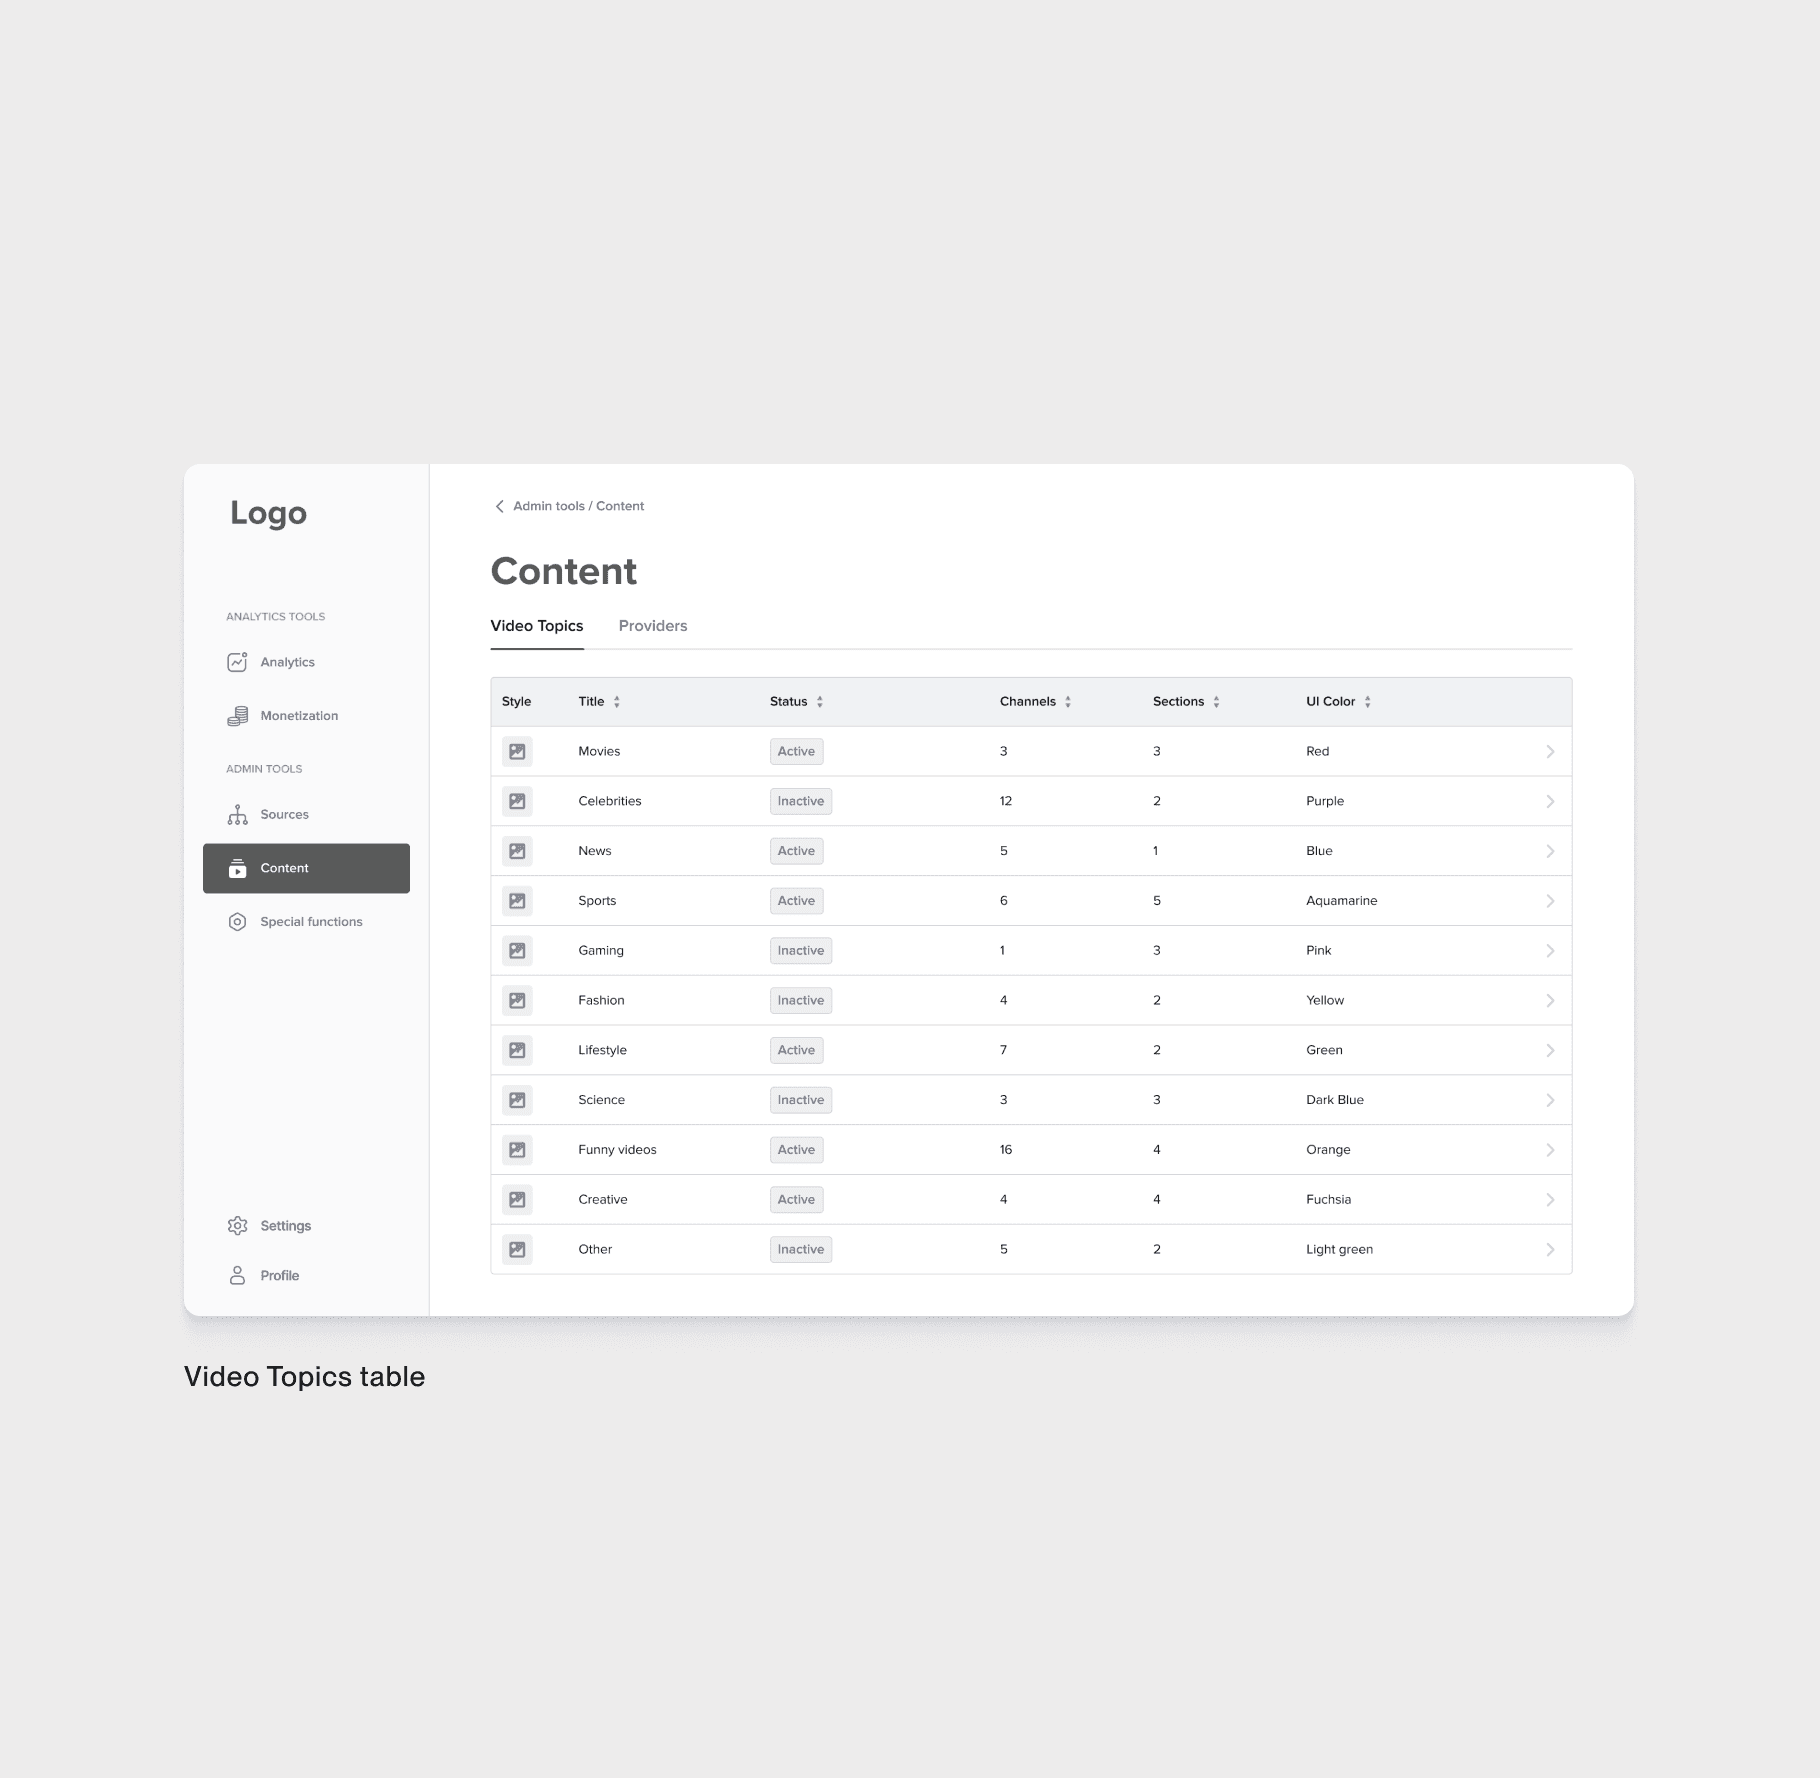
With access to stakeholders throughout this project, I prioritized creating high-fidelity wireframes to quickly iterate and gain approval on ideas. I developed wireframes for key layouts, so the developers can start working on working on both the UI and backend.
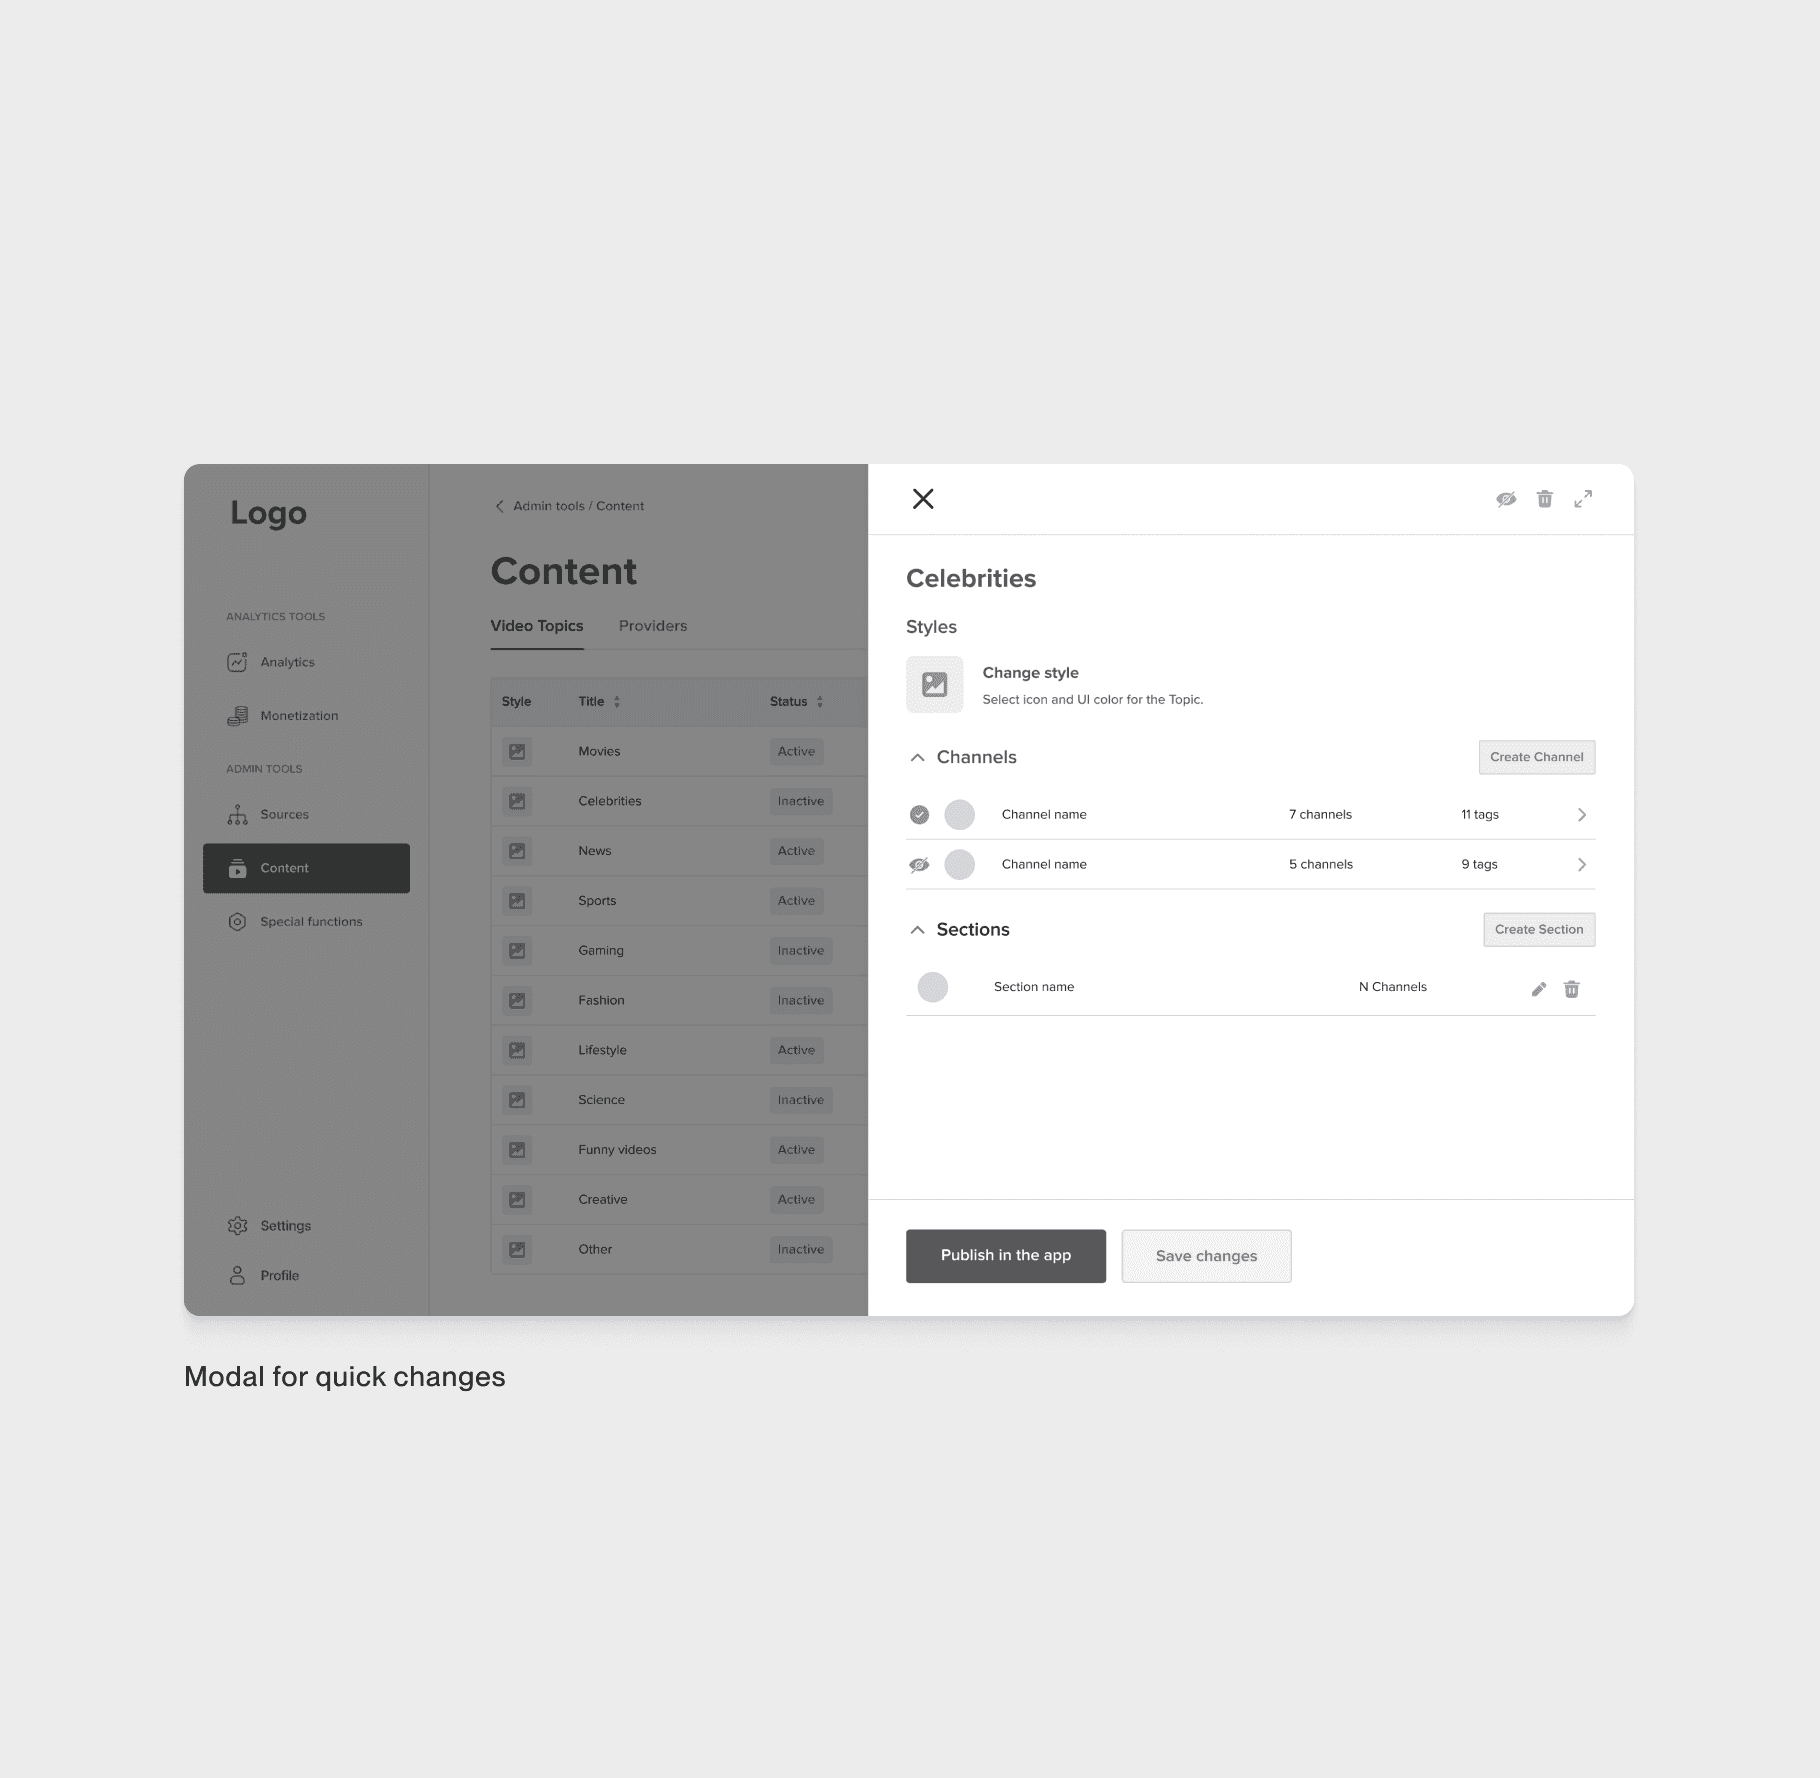
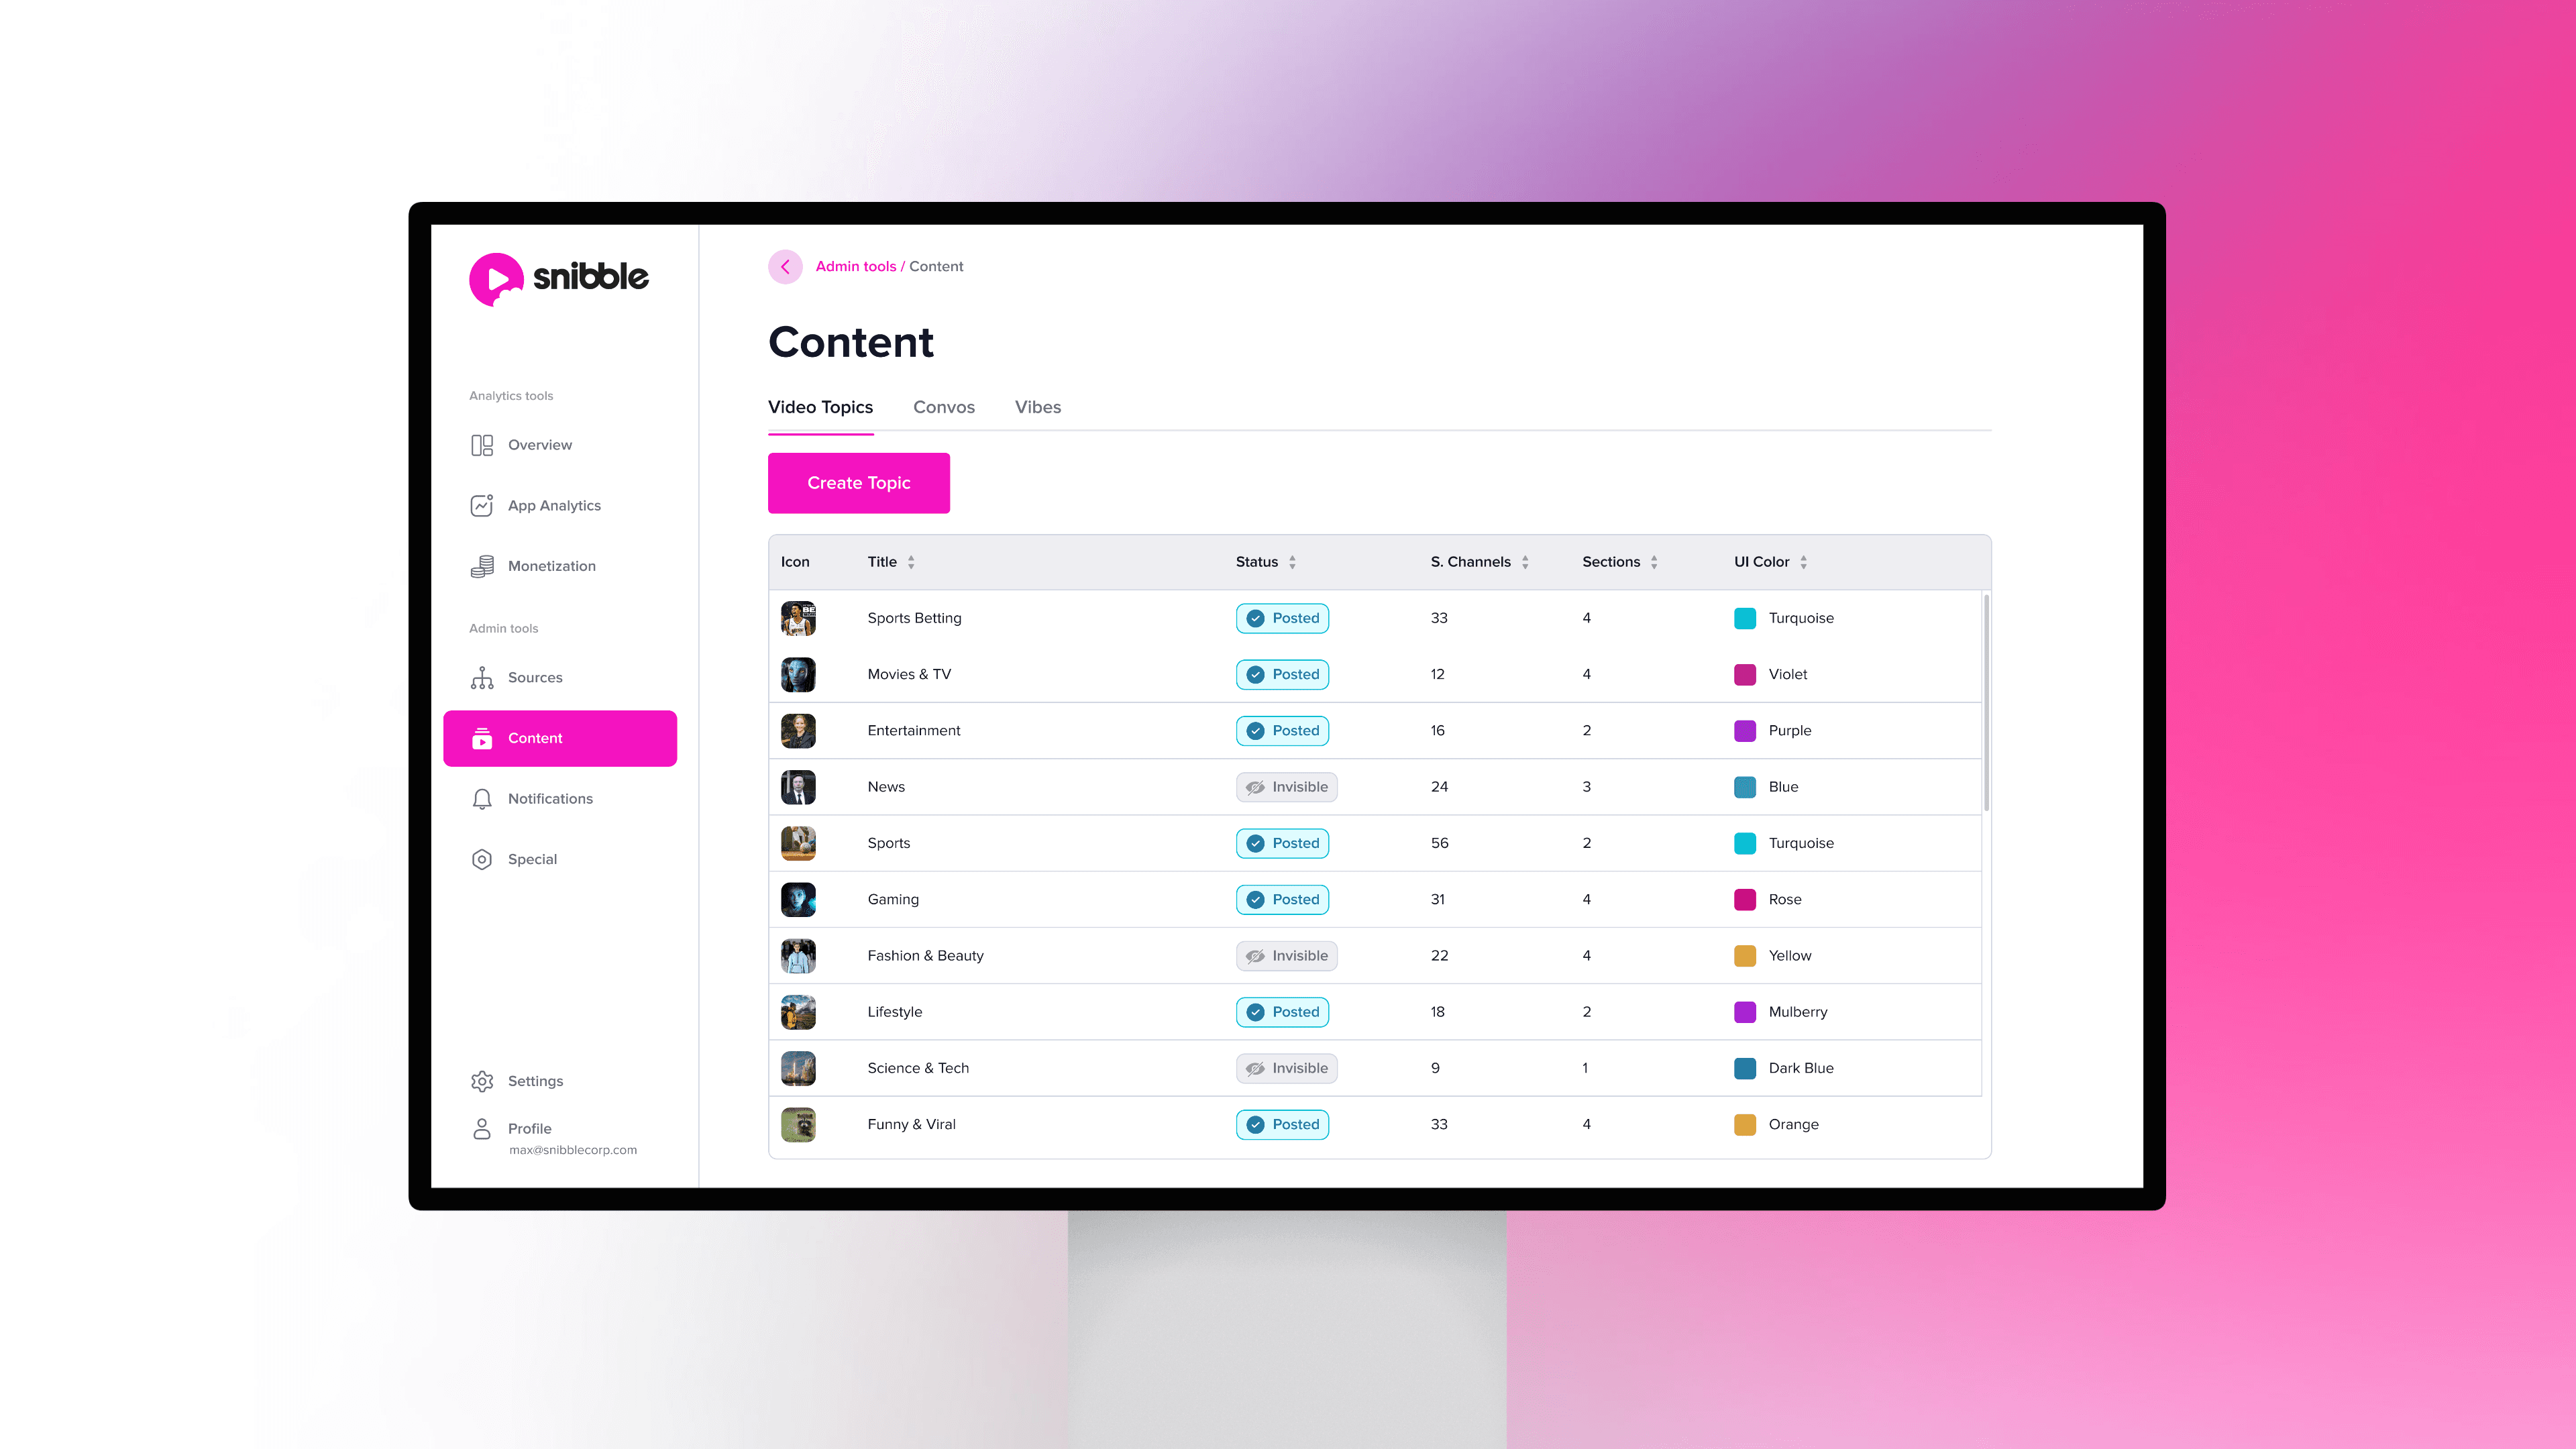
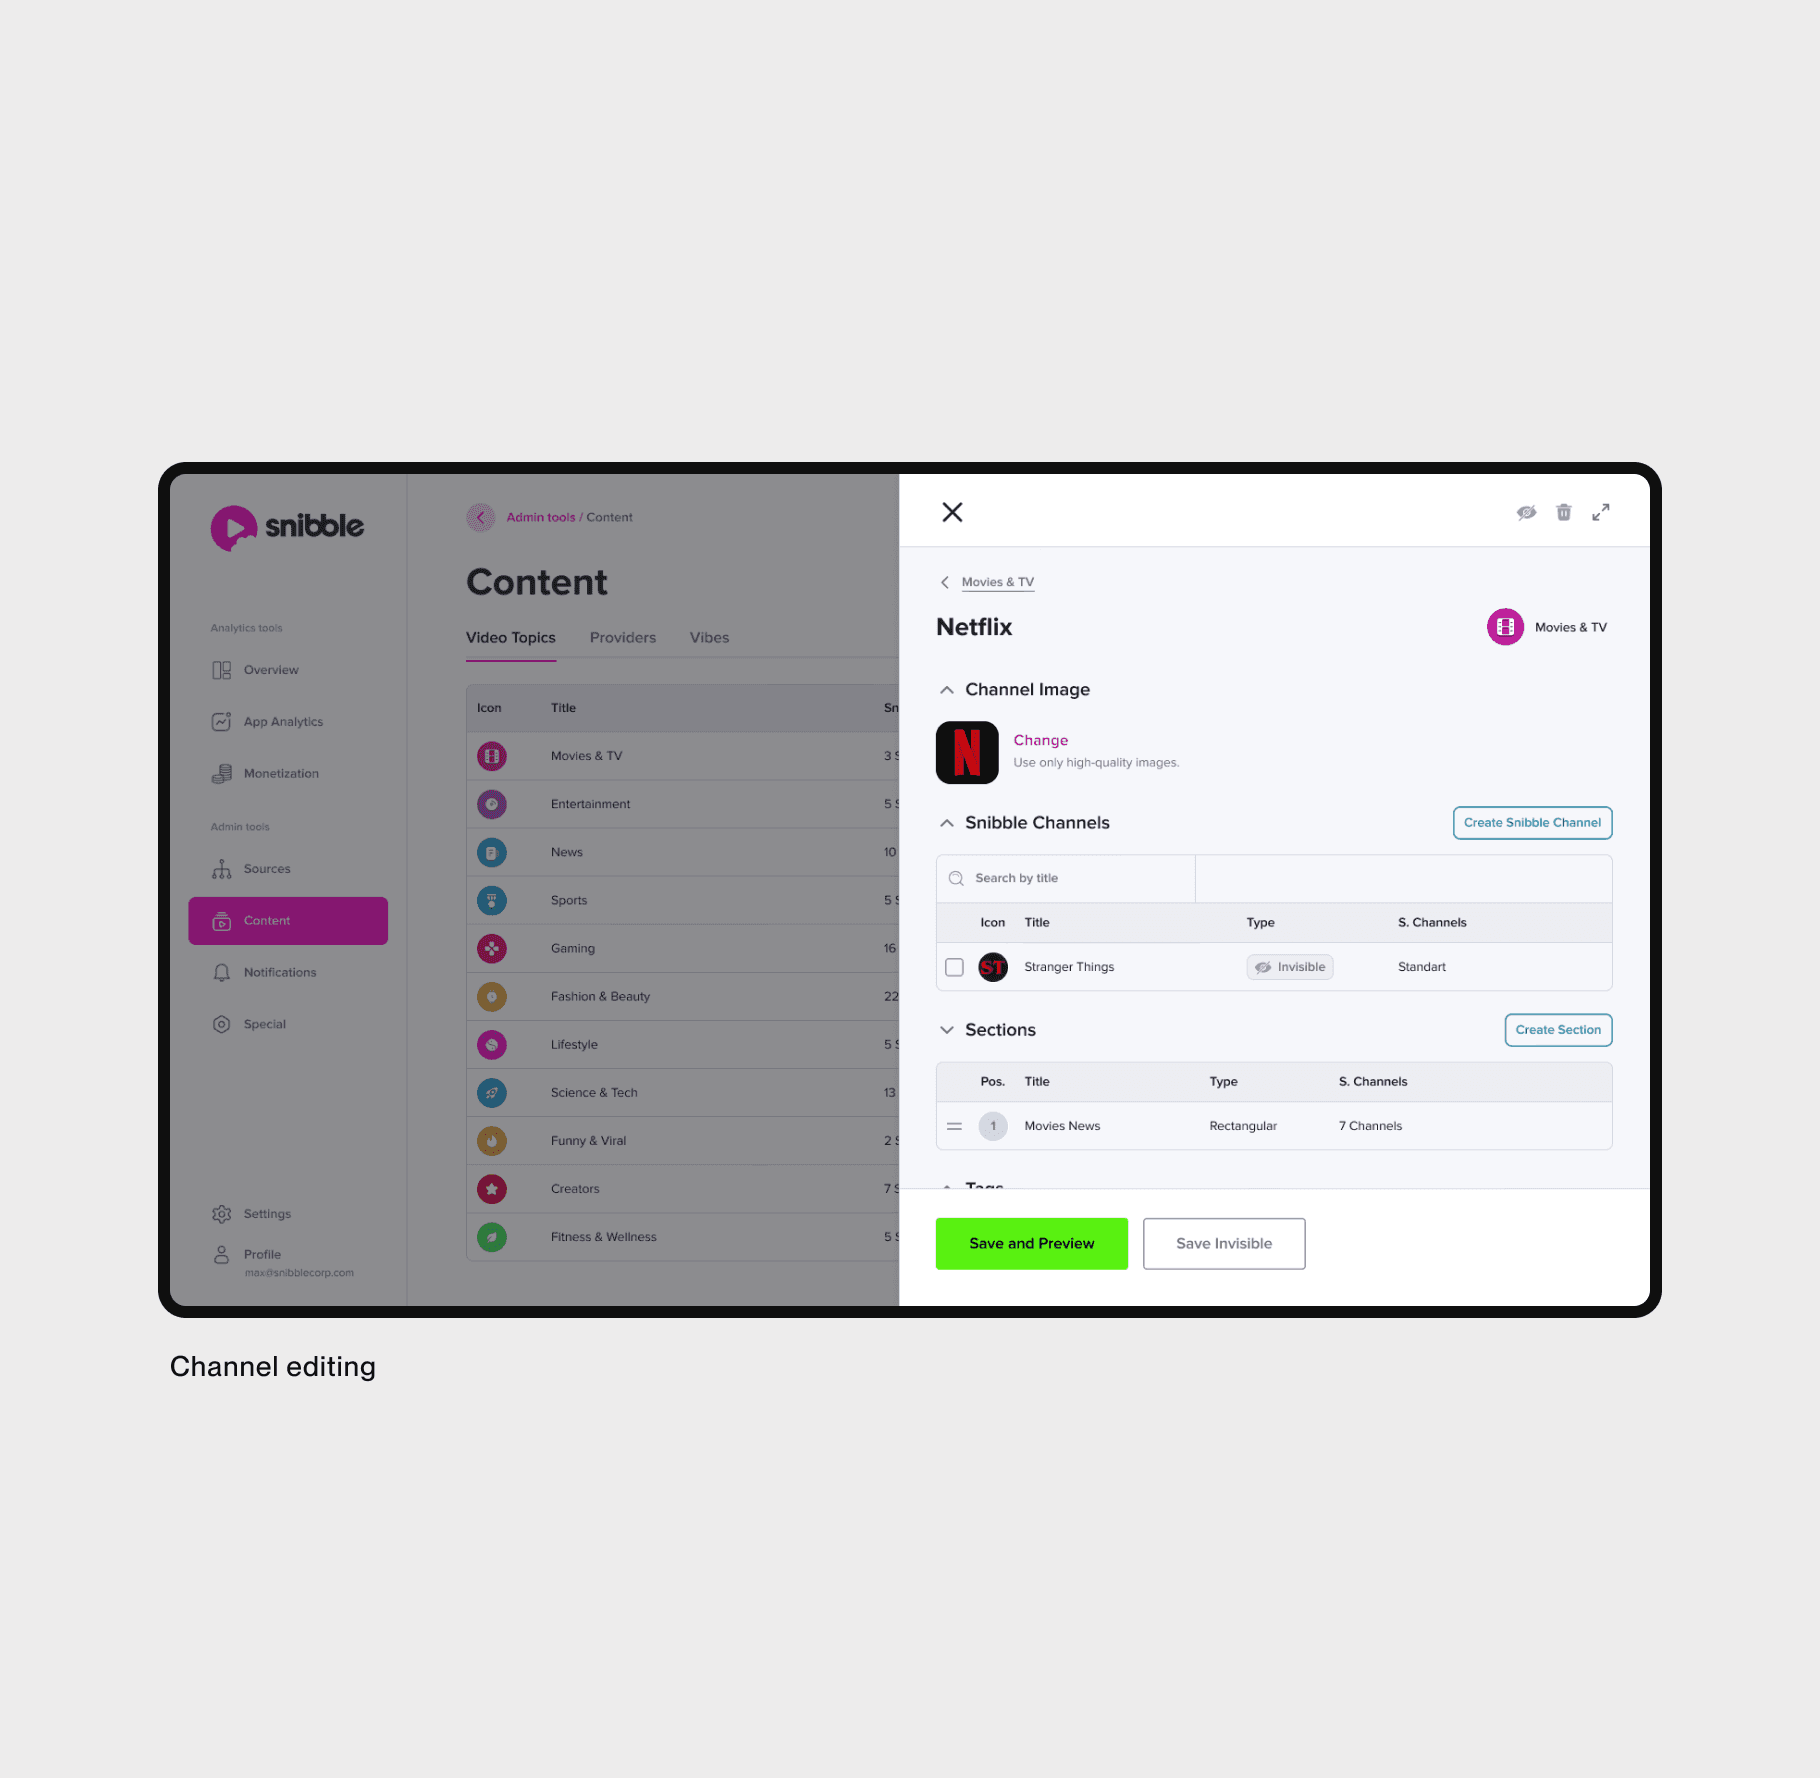
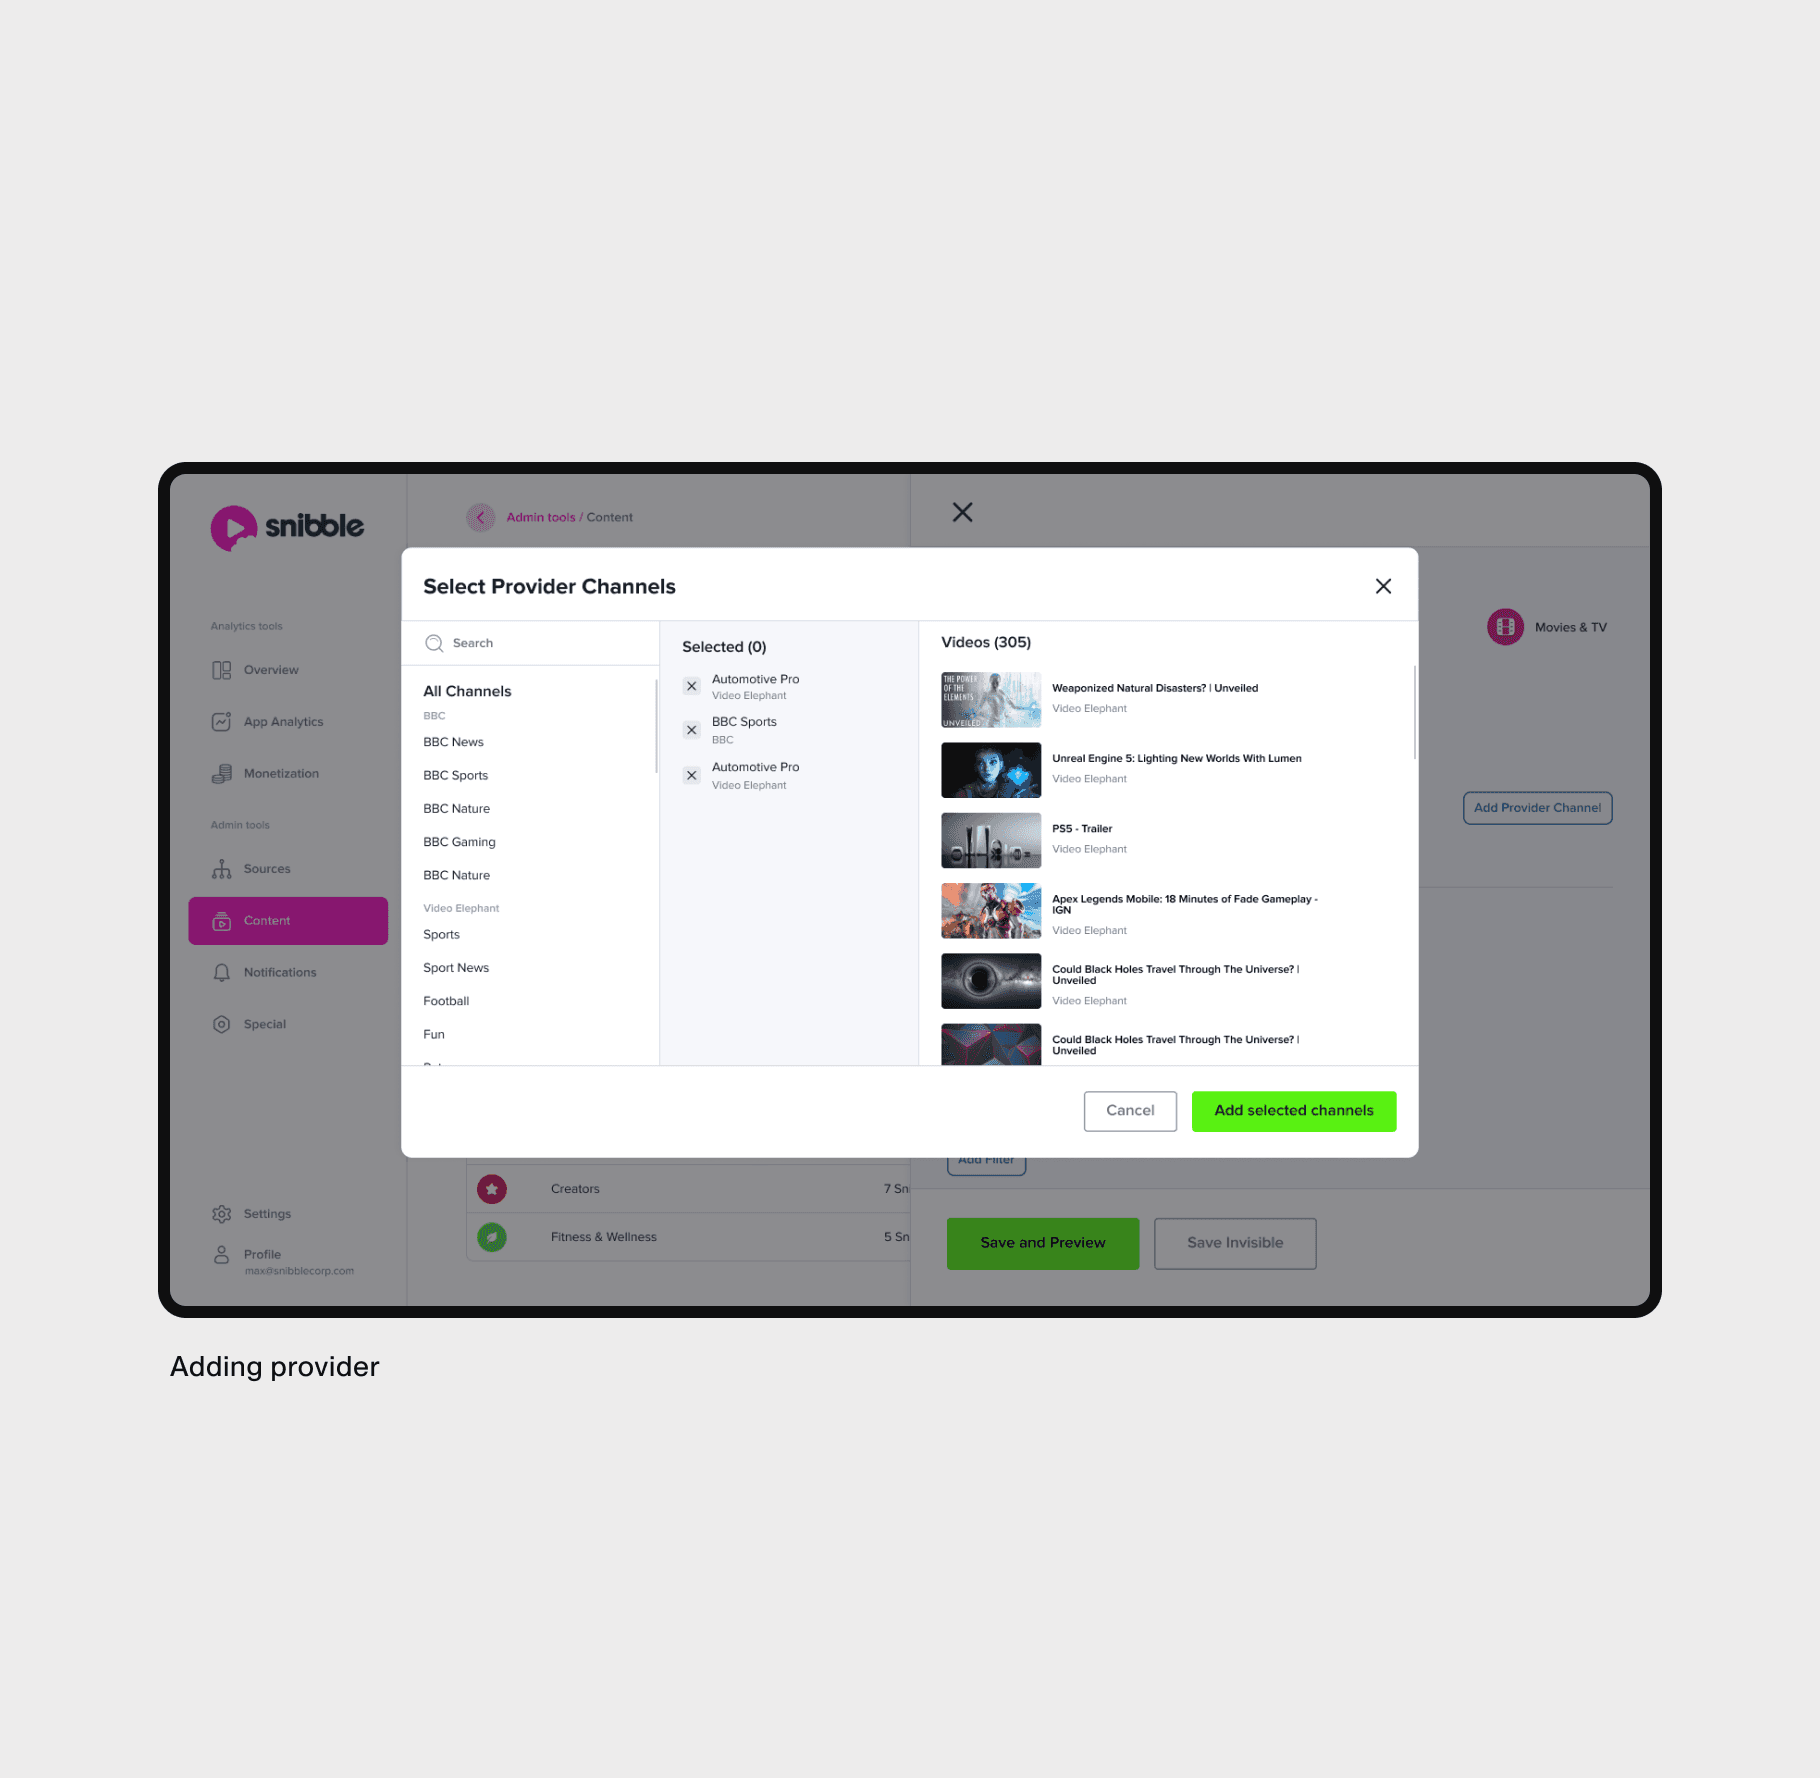
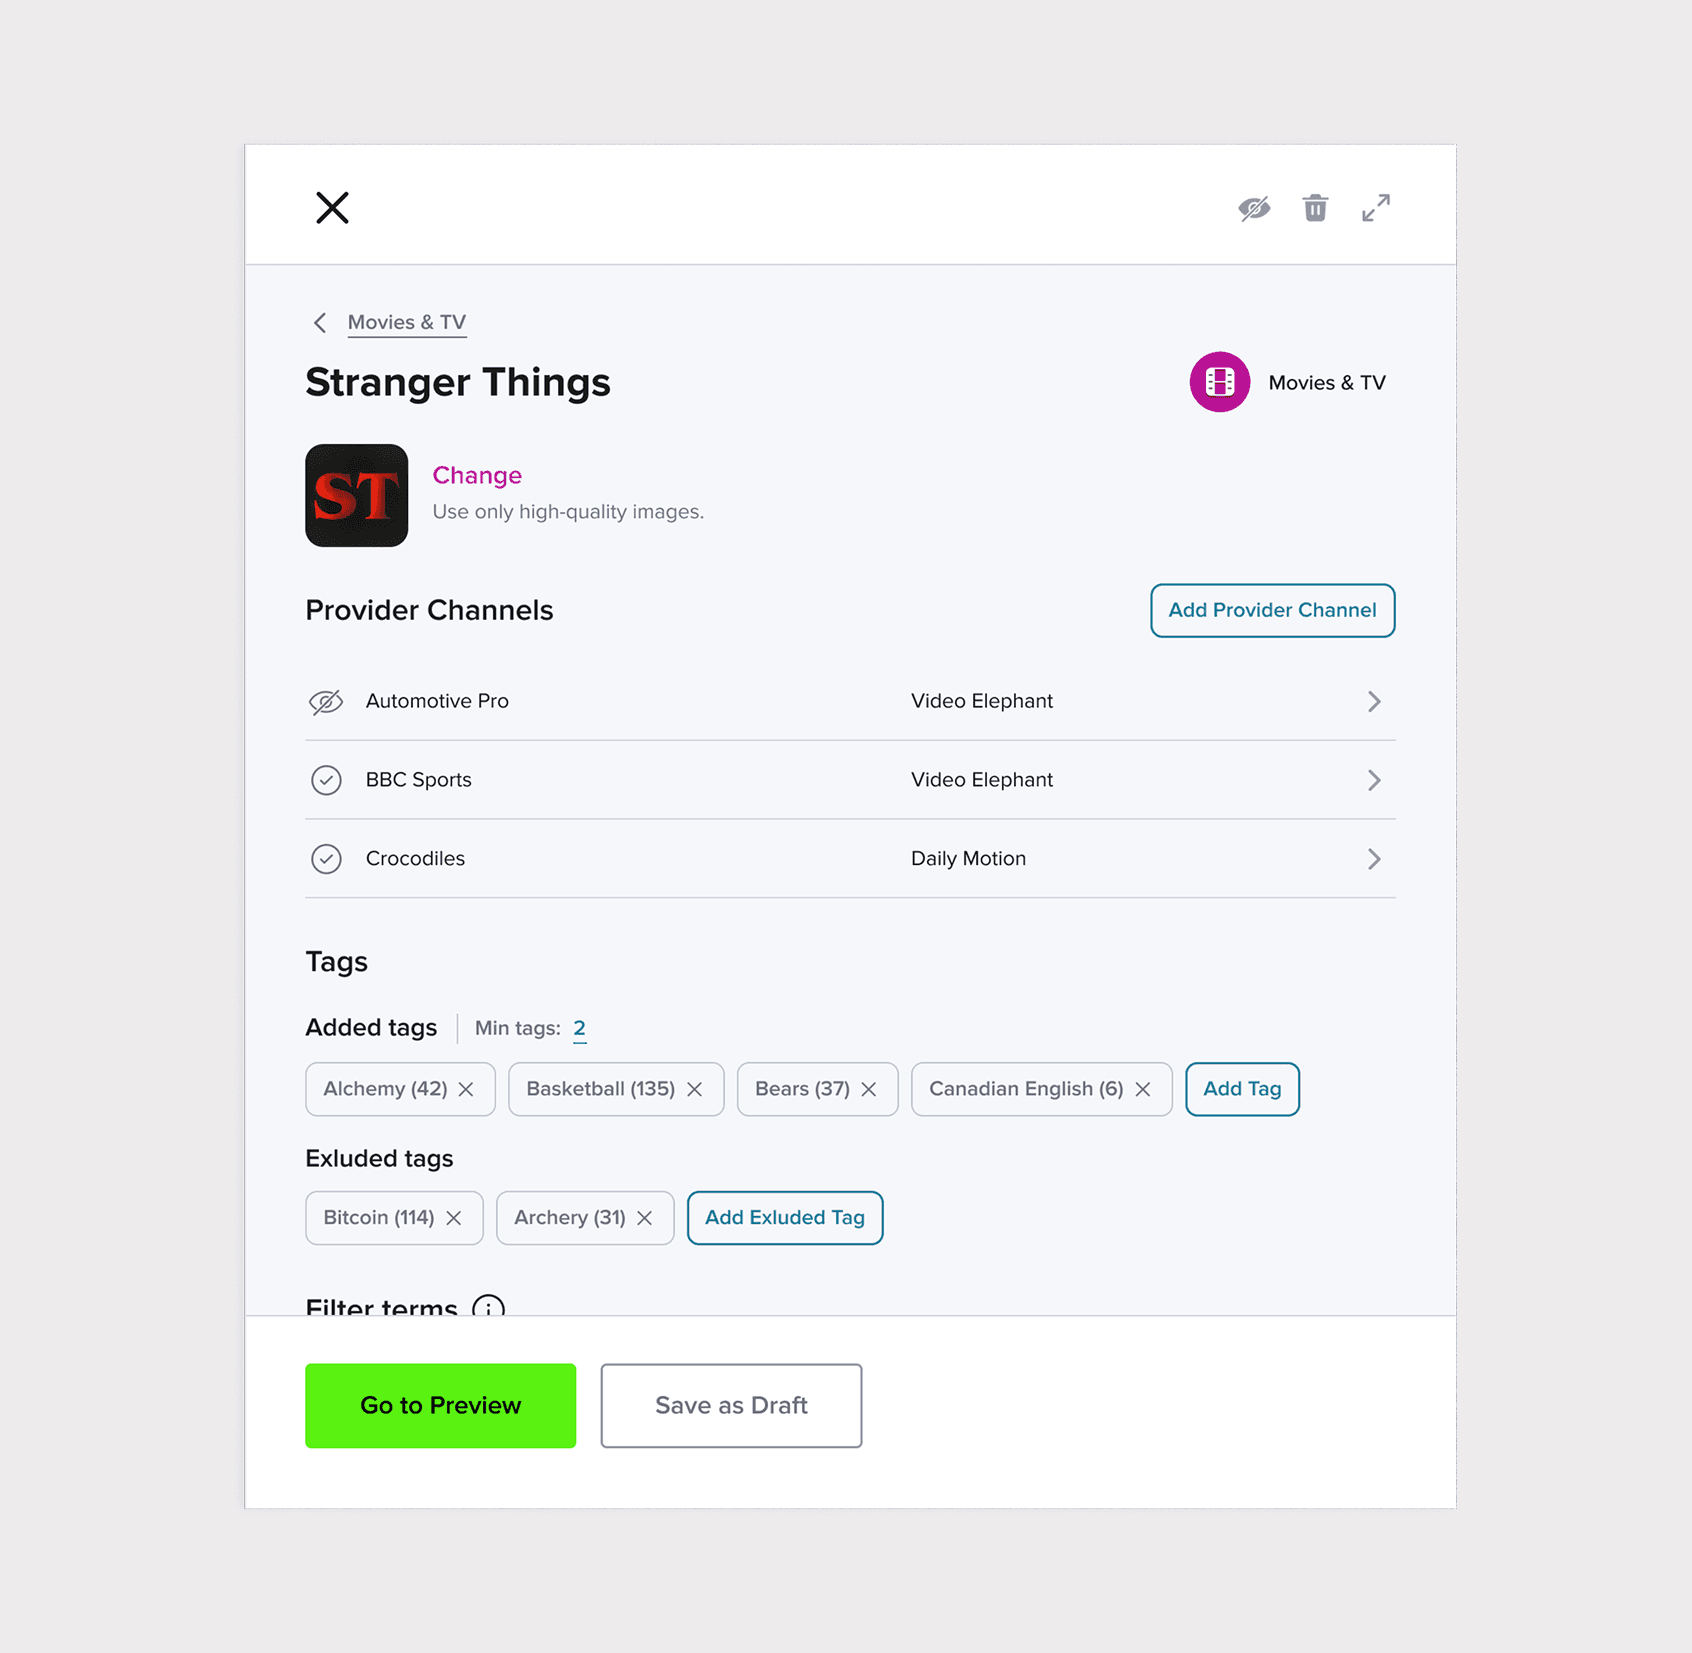
The admin panel allows the internal team to manage content and its categorization on the platform, reducing the load on back-end developers who previously had to handle content management manually through code.
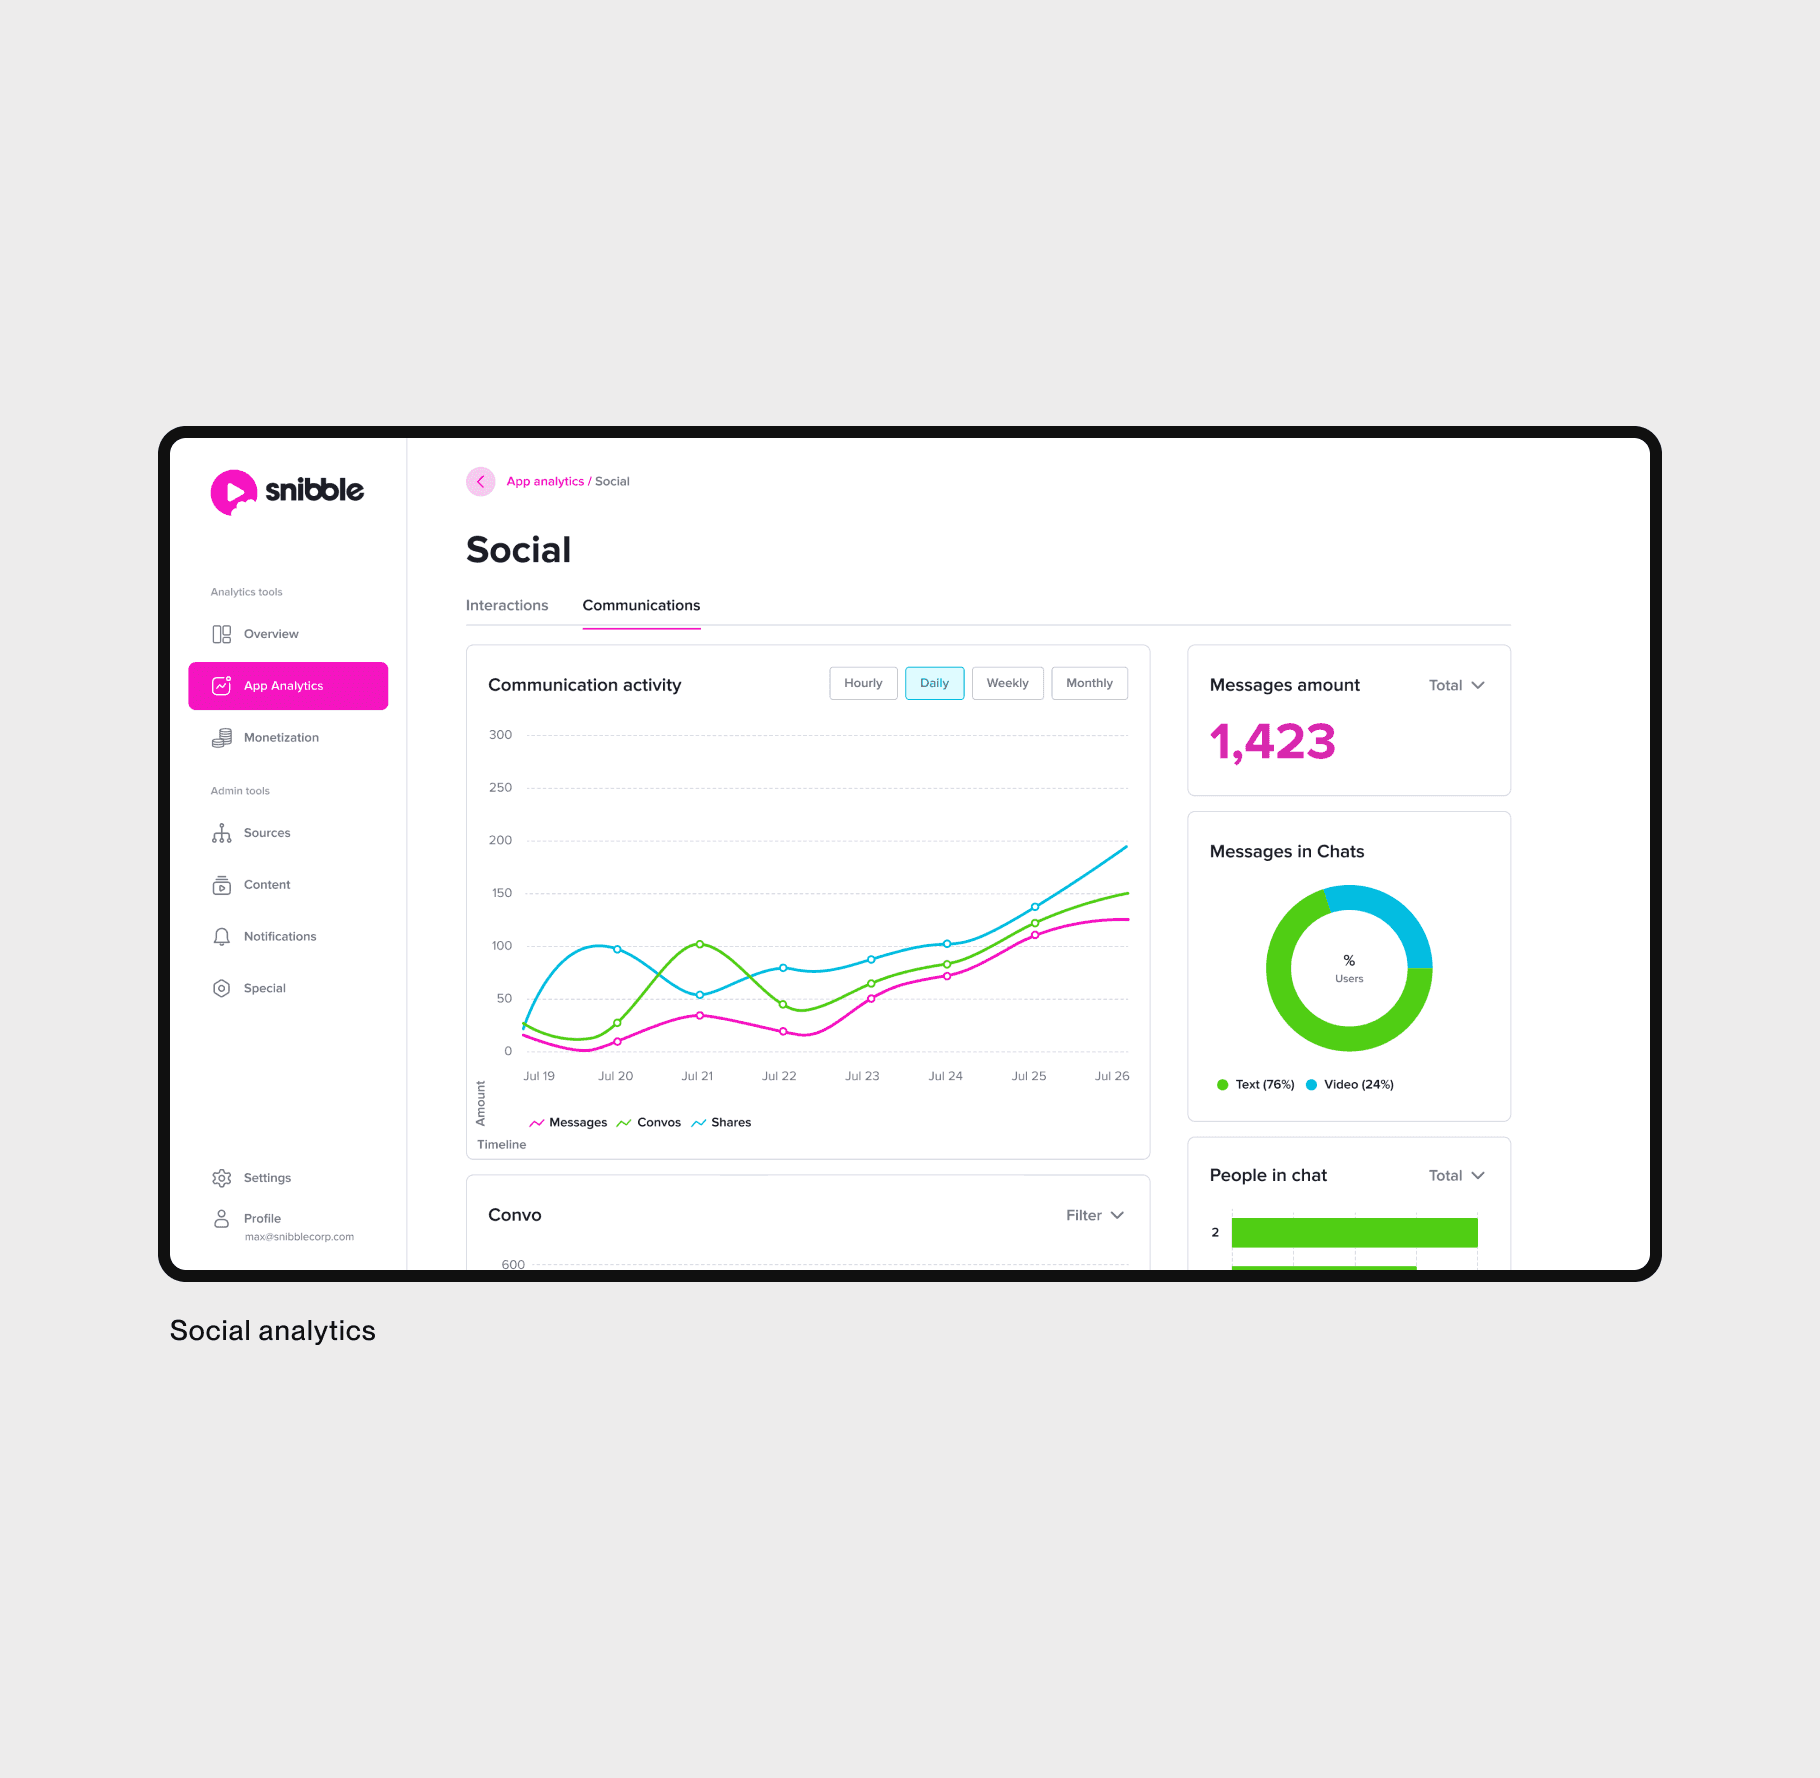
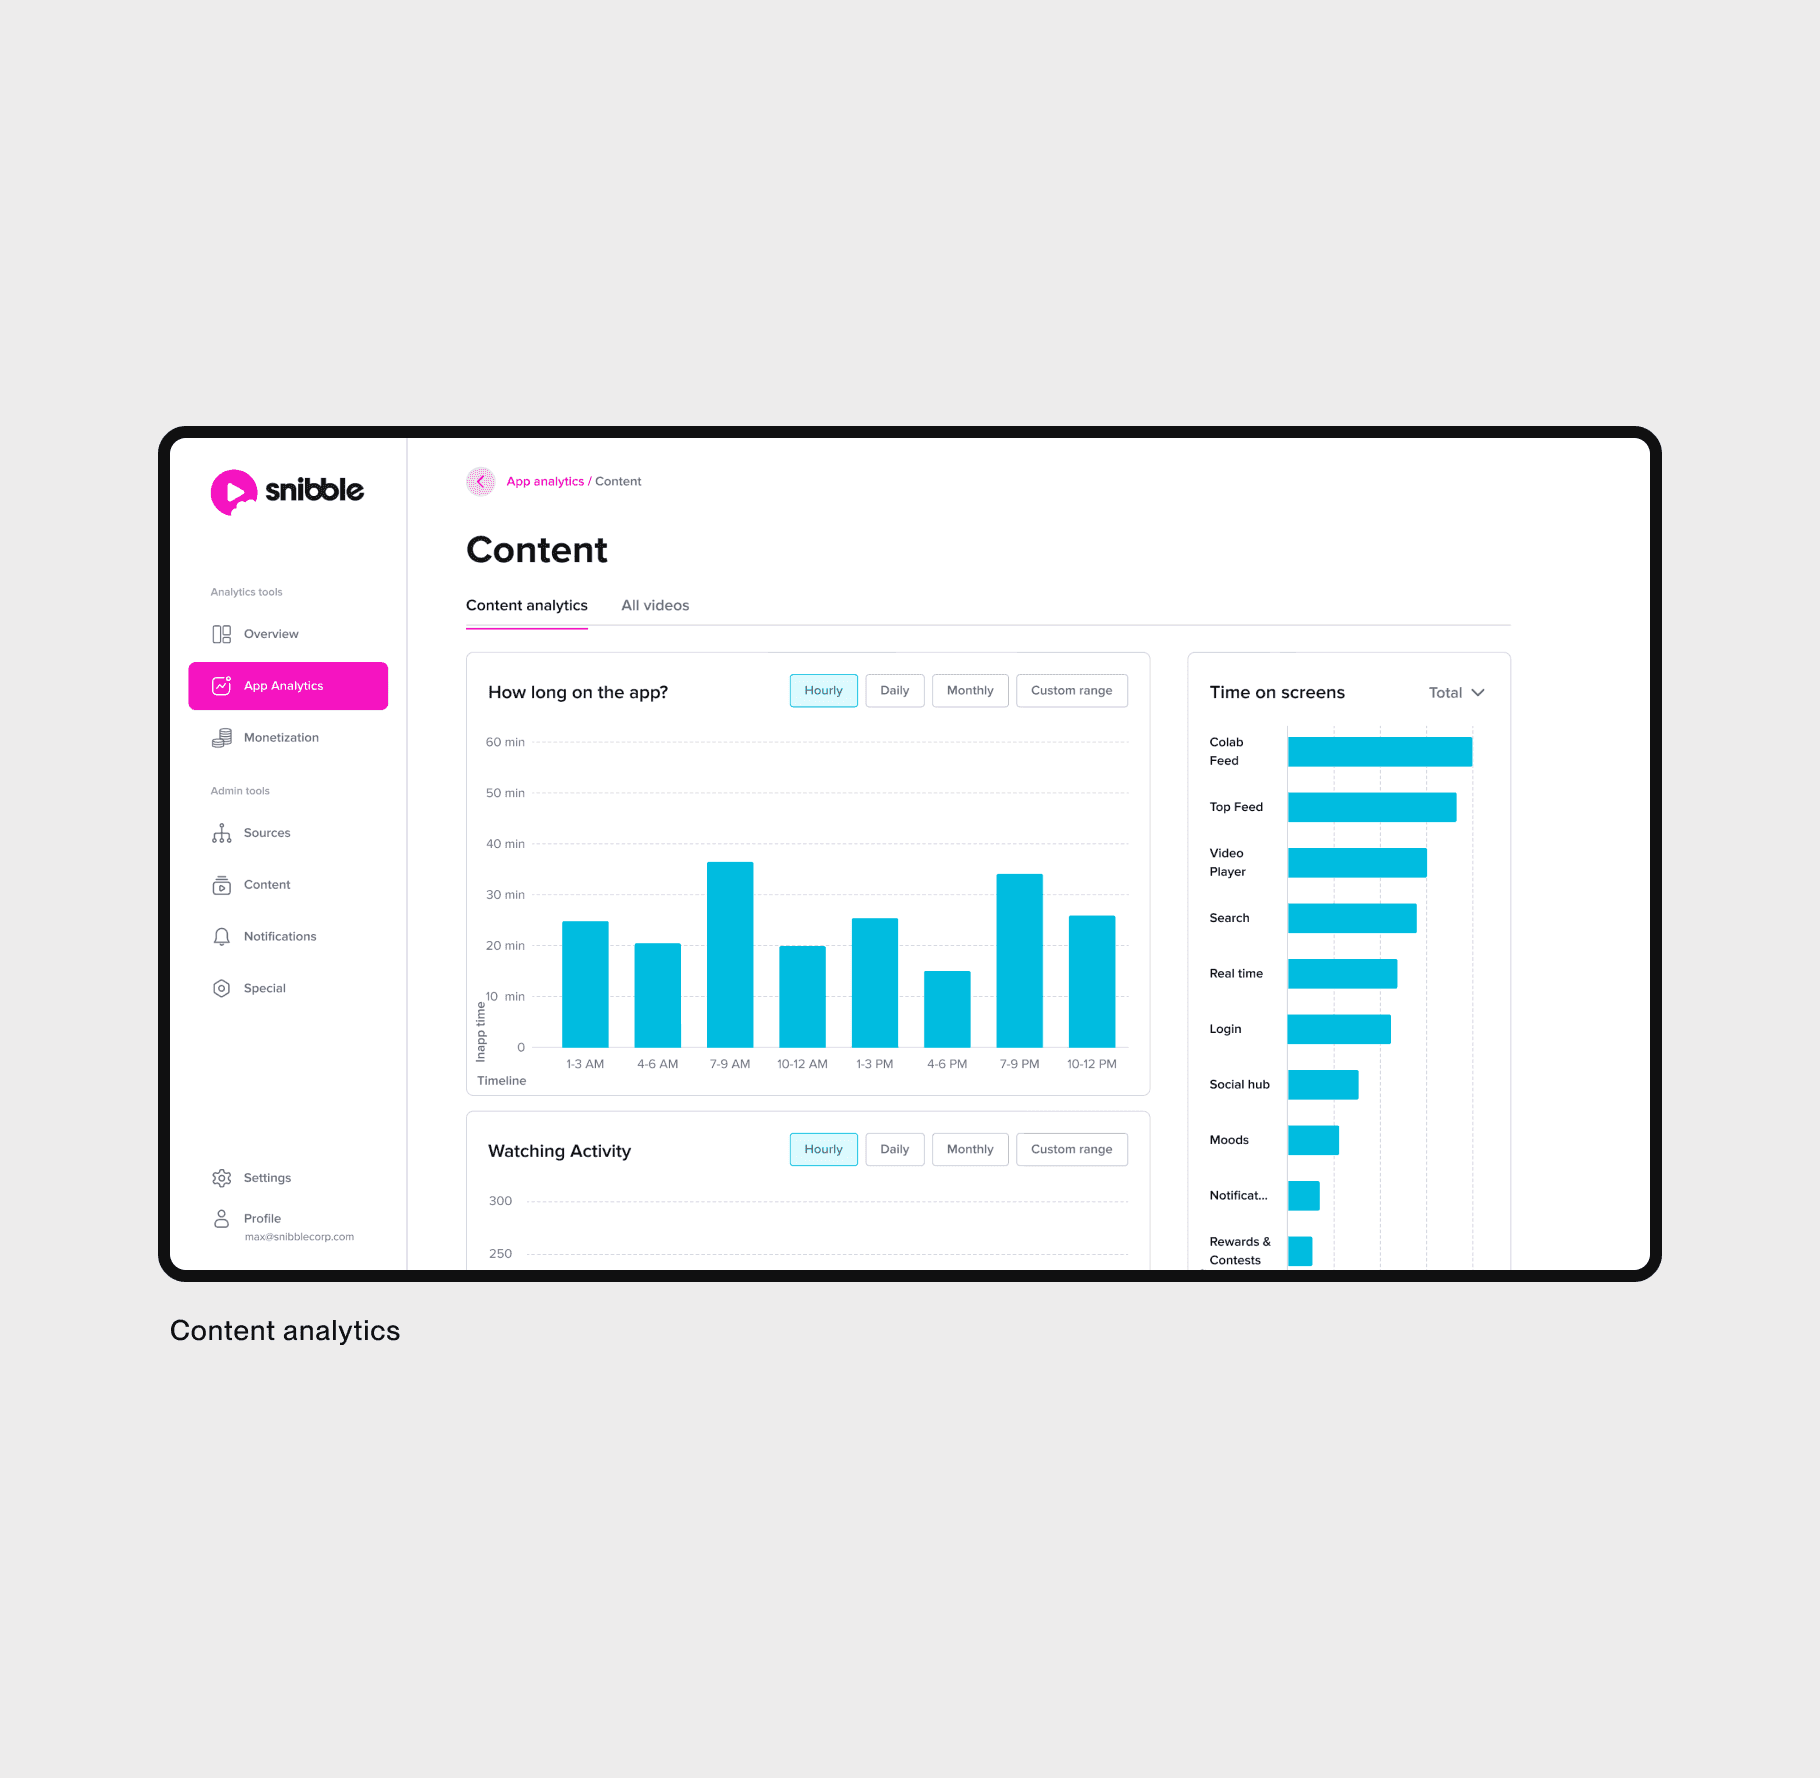
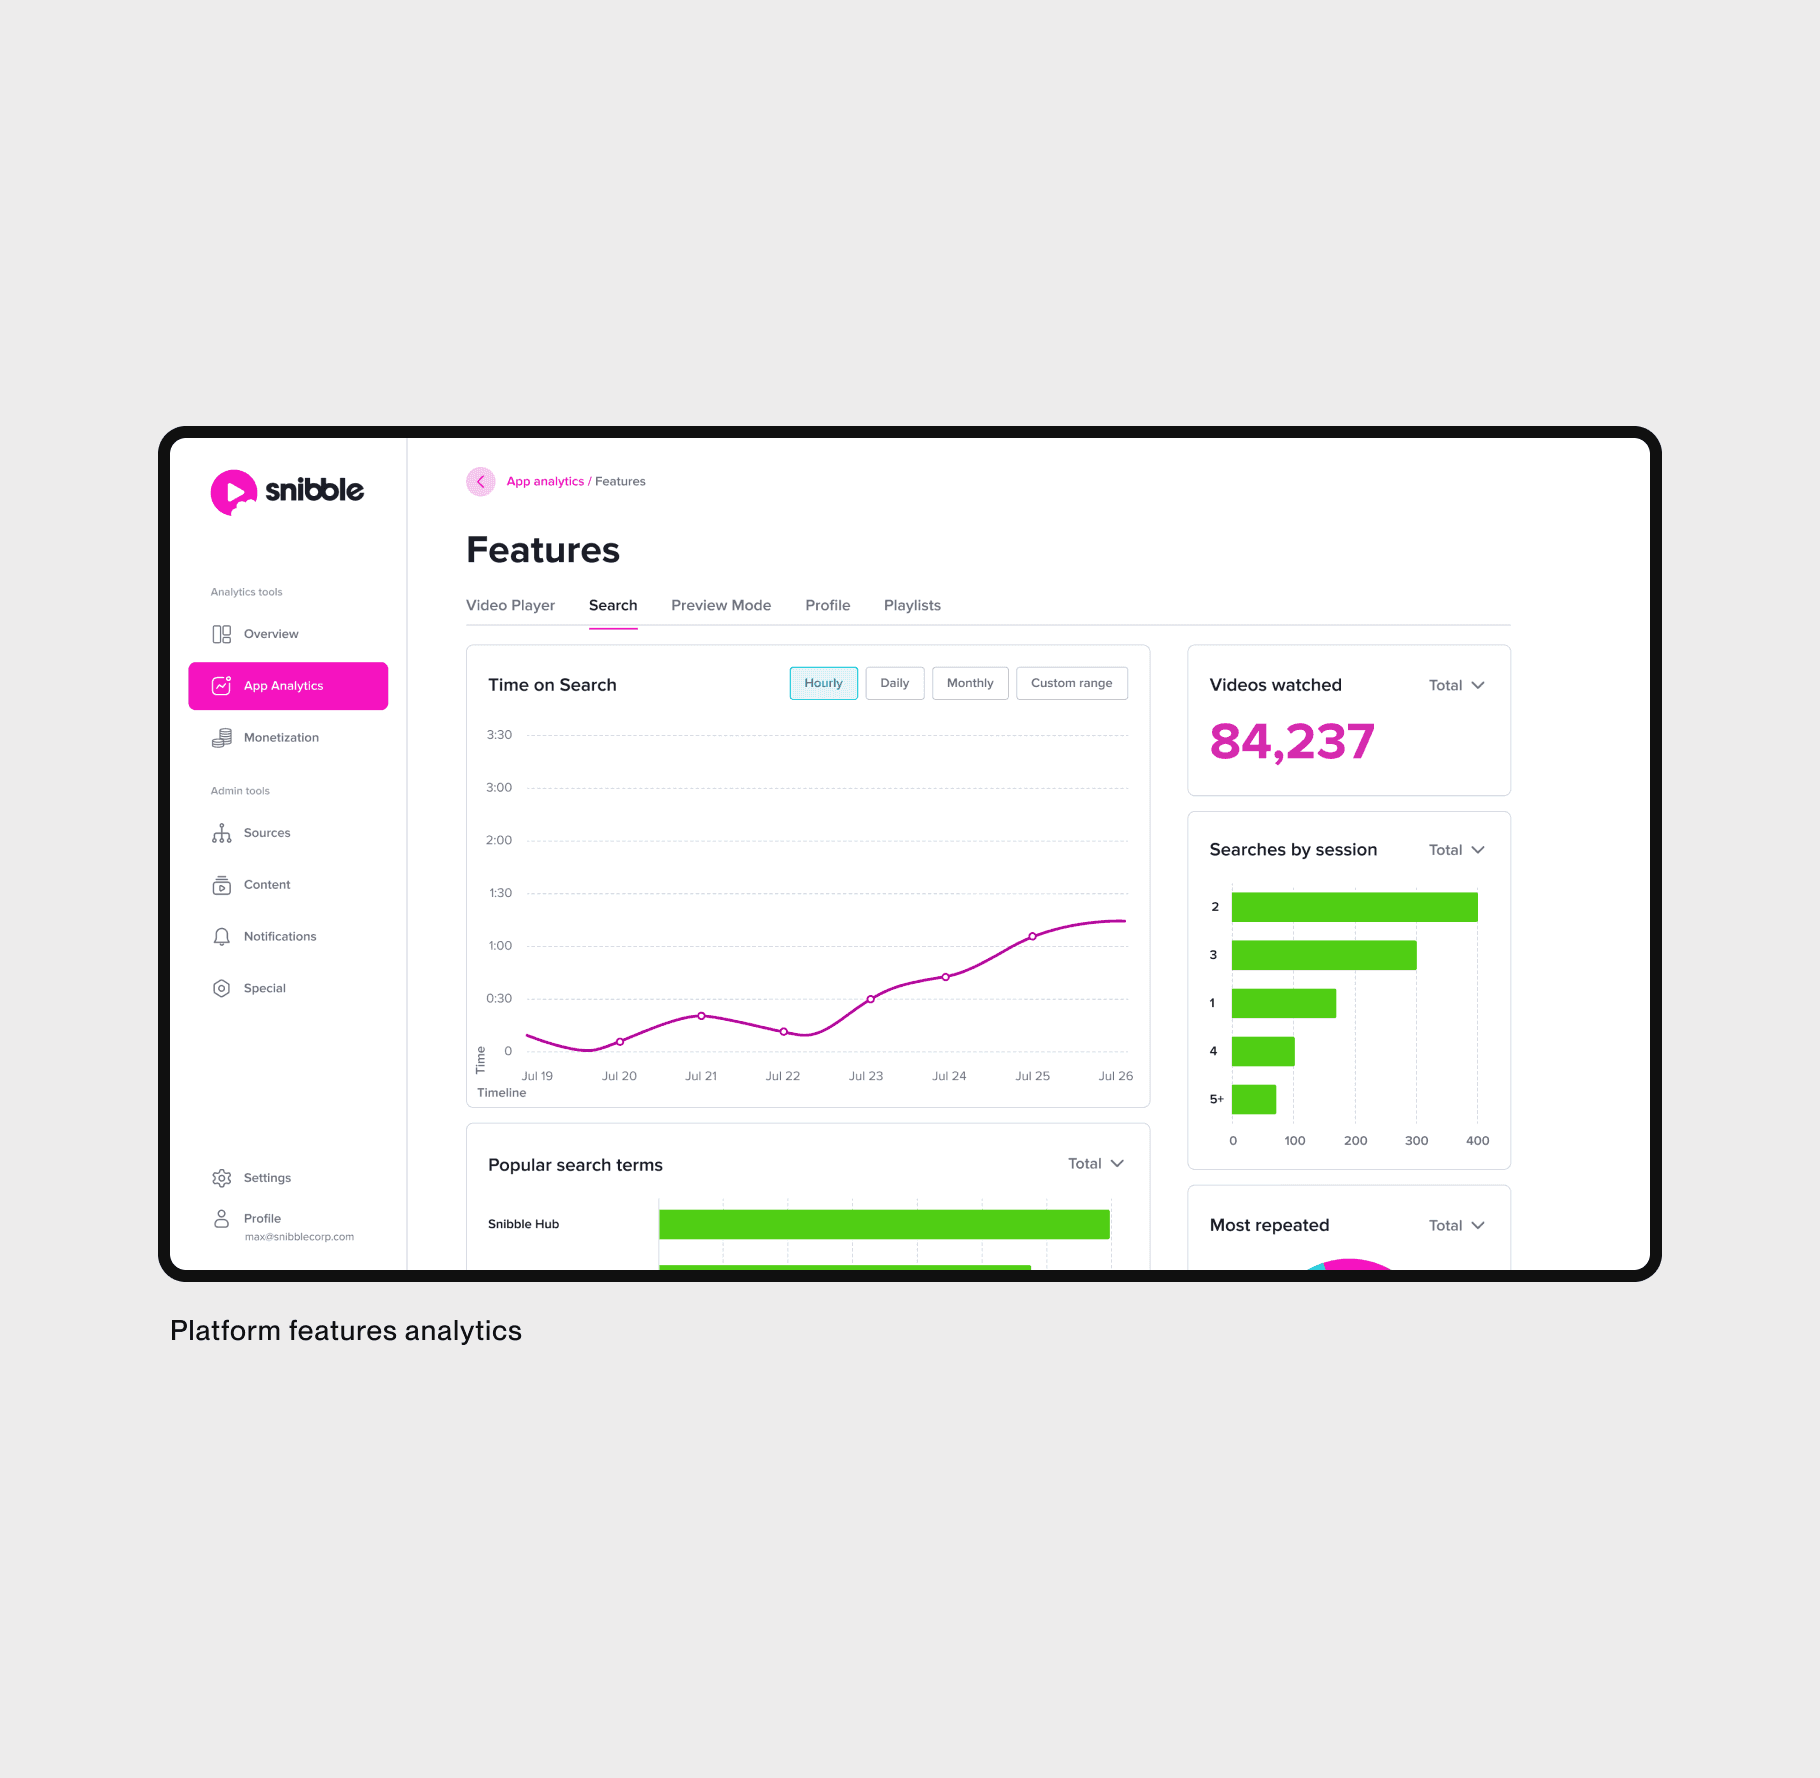
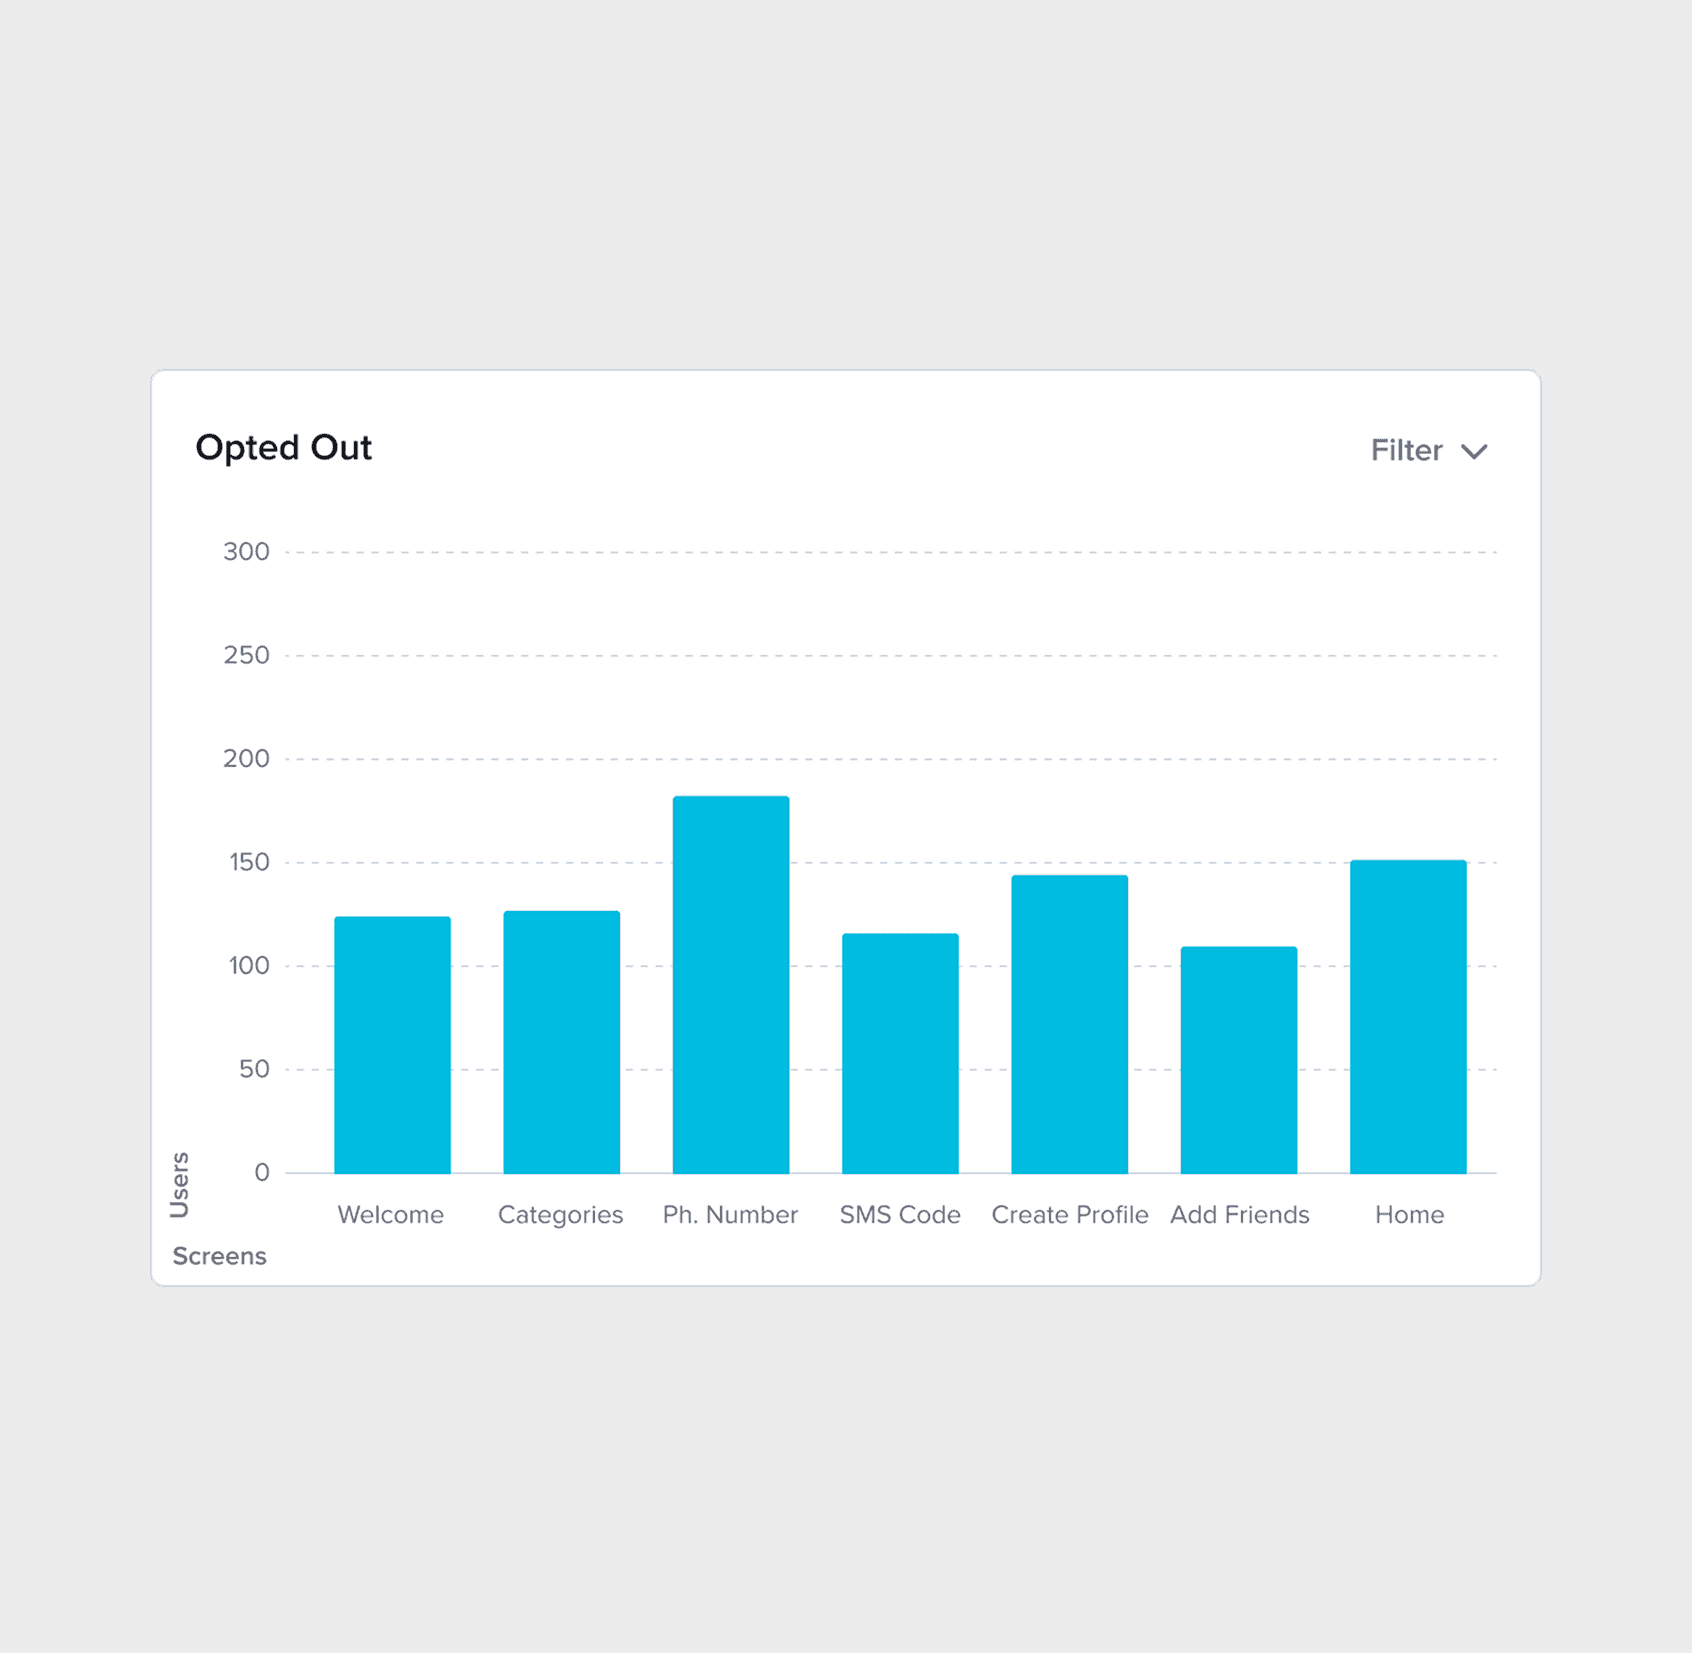
In order to better understand user and content behaviour on the platform we designed internal analytics with focus on tracking social engagement with platform features and content.
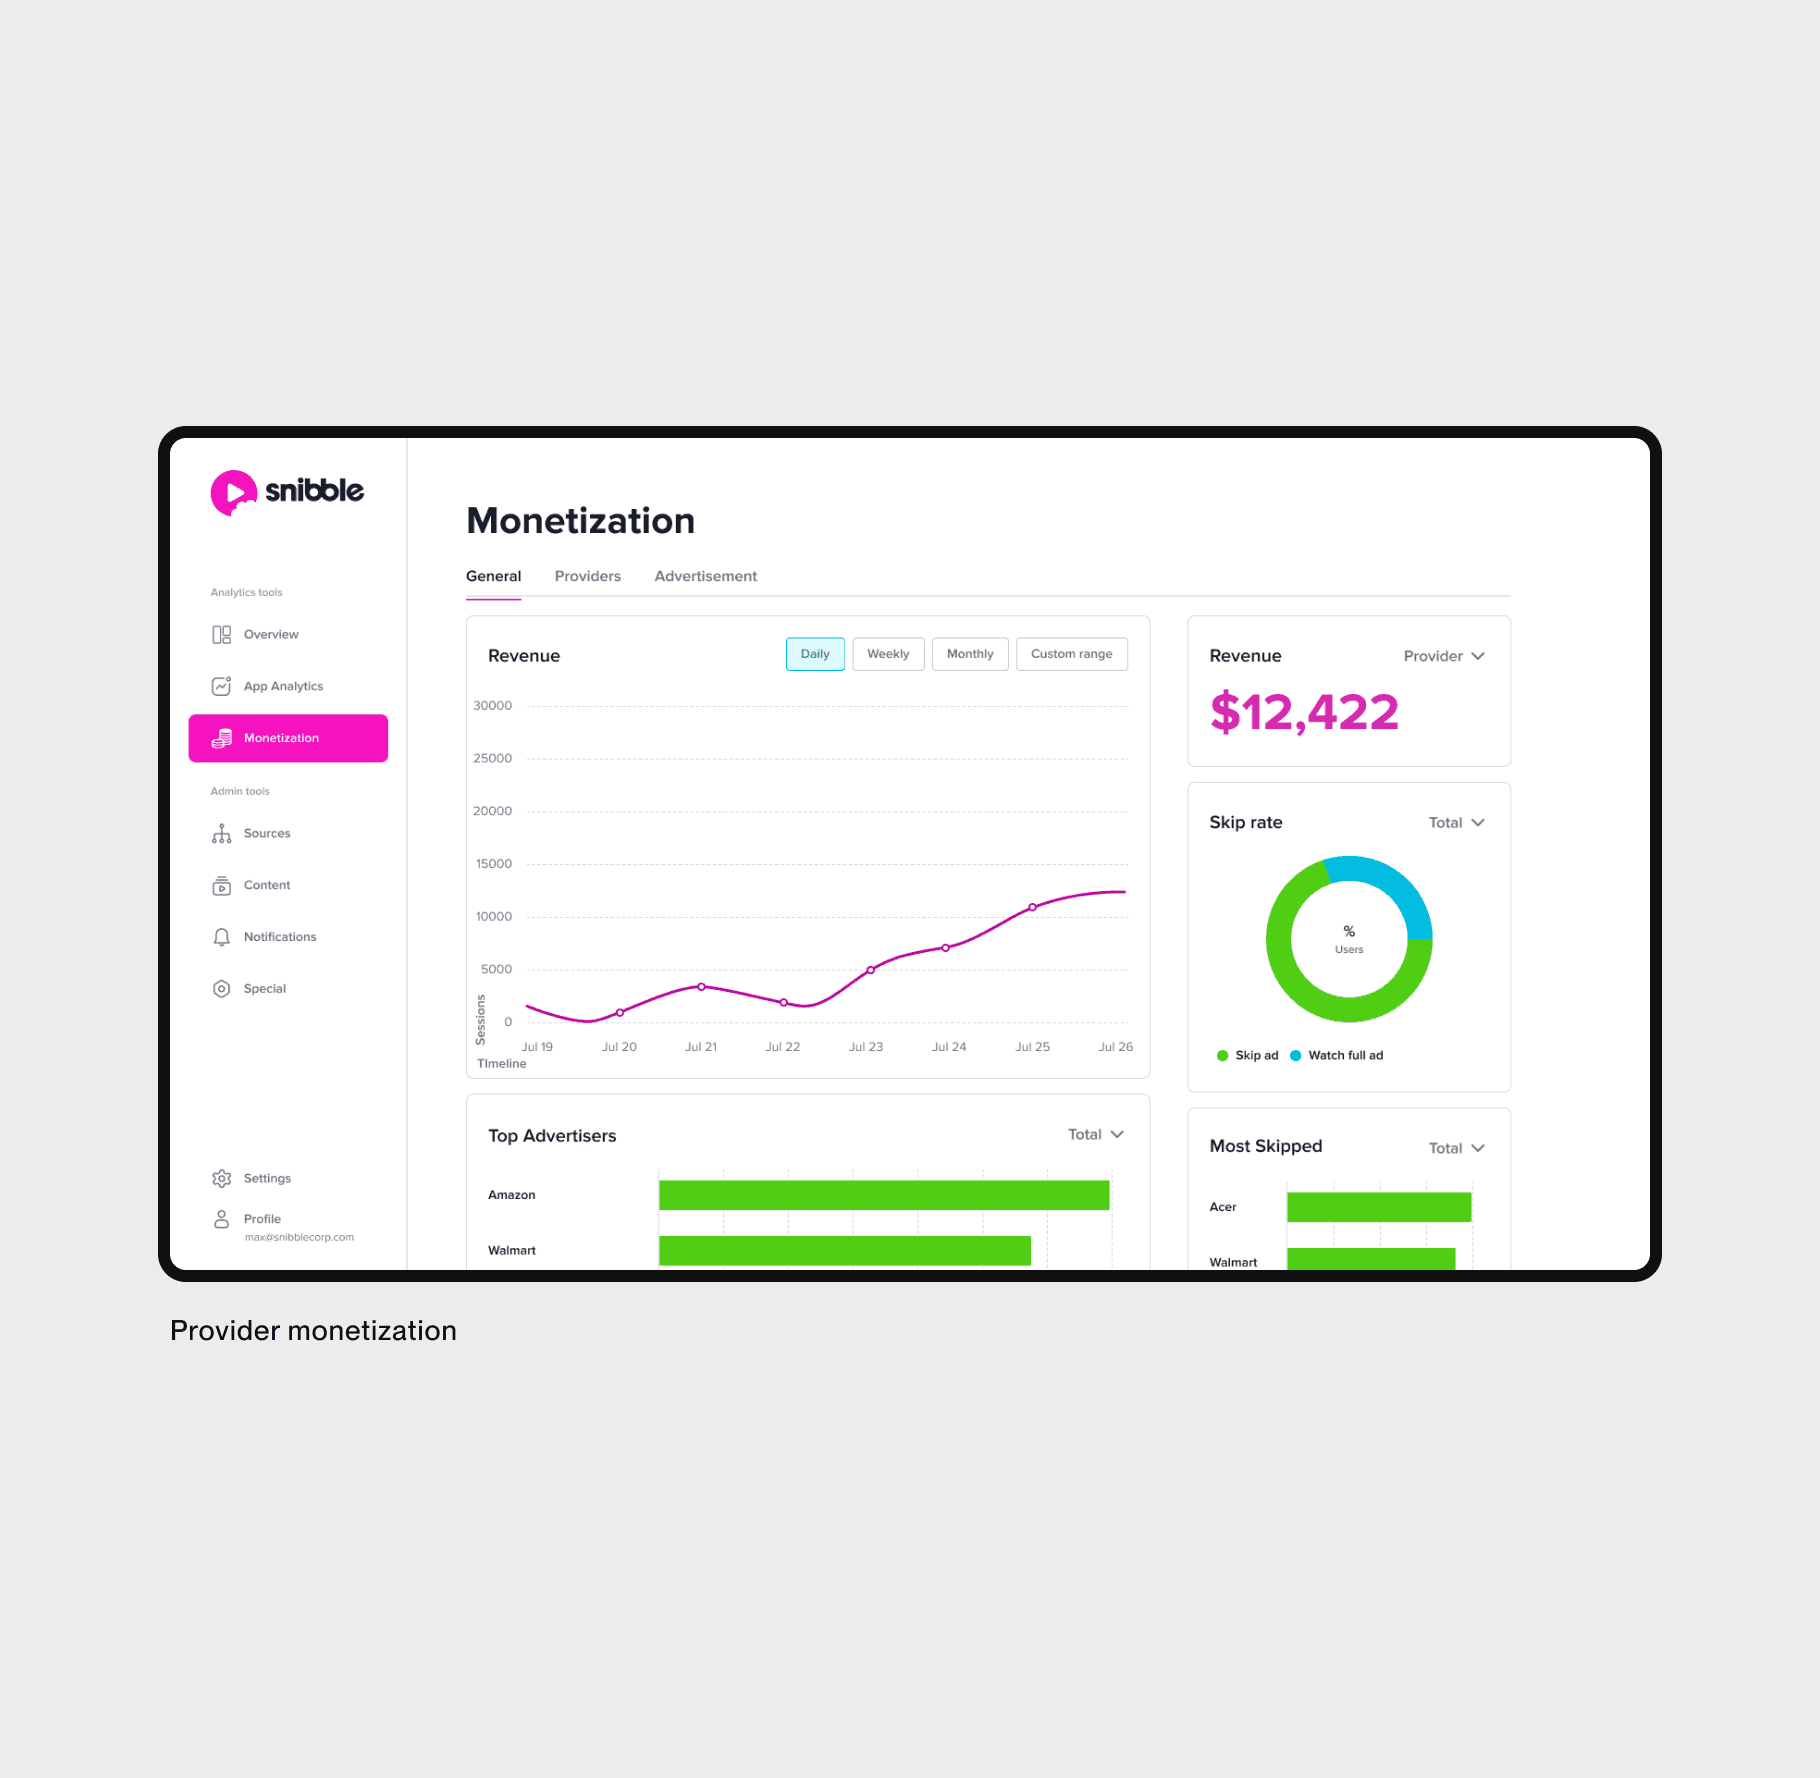
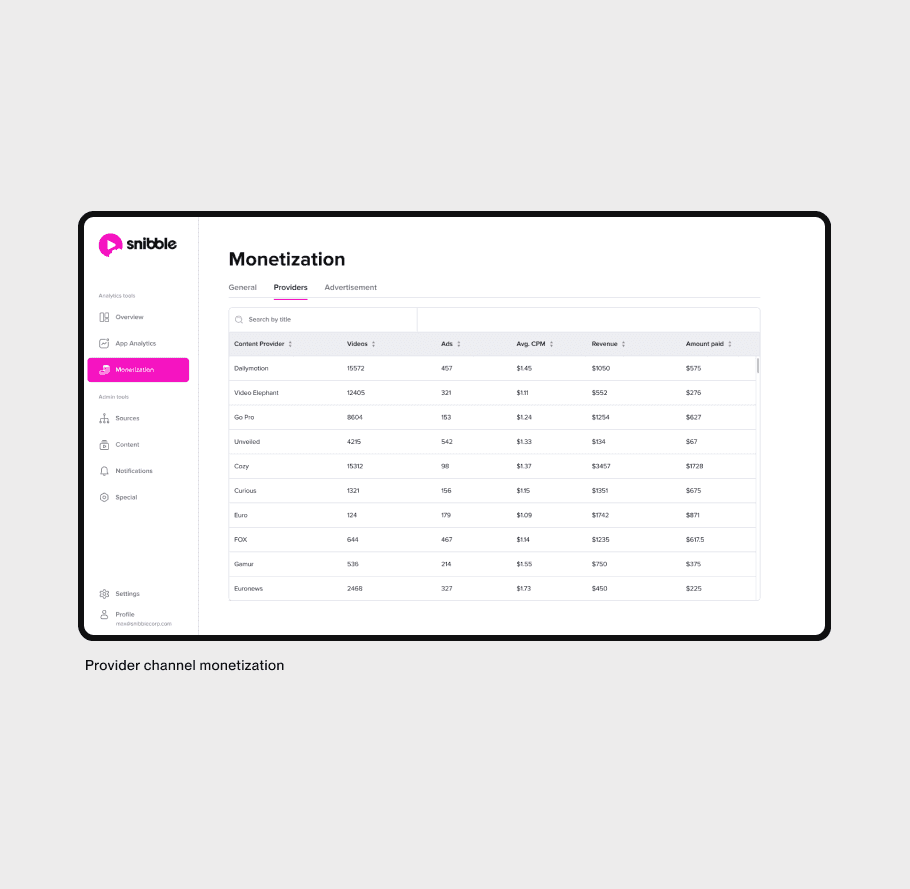
Being primarily ad driven platform, monetization tracking was also included as part of the project. Although there are good third party tools that lets you track revenue we decided to design our own that can be used by a company and its partners.
In the final phase, I ran weekly QA sessions to fix critical bugs and ensure the web app worked across desktop browsers and tablets. Since the dashboards handled large data sets, I focused heavily on UI testing.
Afterward, I continued testing the product and working on updates. The most valuable data came from observing how the content managers and stakeholders interacted with the dashboard.
Content Managers
• Reduced content update time by 80% (from up to 2 weeks to 30min)
• Direct filter control → fewer irrelevant videos
Back-end Developers
• Freed to focus on core back-end instead of content
• Reduced friction with stakeholders on content timing
Partners
• All analytics in one dashboard (no third-party tools) → Improved relationships with company partners
